San Diego Real Estate Blog

San Diego Real Estate Blog - Real Estate News and Information in San Diego County California - Blog about Real Estate in San Diego County California


Jan. 28, 2026

La Jolla Real Estate Market Update January 2026

Homes and Condos in La Jolla California

Coastal San Diego | ZIP Code 92037 | La Jolla Real Estate

La Jolla has always been one of San Diego’s most resilient and desirable coastal markets, and as we move into January 2026, that reputation continues to hold. Even with higher price points, interest-rate uncertainty, and a slower national housing market, La Jolla real estate remains driven by scarcity, long-term wealth buyers, and lifestyle-focused demand.

What makes La Jolla different is not volume—it’s quality, location, and long-term value preservation. Below is a detailed look at where the market stands today, how it changed from 2024 to 2025, and what buyers and sellers should expect heading deeper into 2026.

La Jolla Real Estate 2026 Market Update January

Big Picture: A Market Defined by Scarcity, Not Speed

La Jolla is not a speculative market. Buyers here tend to be:

  • Long-term homeowners
  • Cash or high-down-payment buyers
  • Equity-rich move-up buyers
  • Out-of-area and international buyers seeking a coastal asset

Because of that, La Jolla tends to hold value during slower cycles and appreciate steadily when conditions improve. The 2025 data reflects exactly that pattern.

Single-Family Homes in La Jolla (Detached)

Price Trends

  • Median sales price (December 2025): $3,255,000
  • Up 8.3% year over year (December comparison)
  • Up 11.1% on a rolling 12-month basis

This confirms what many locals already know: pricing in La Jolla continues to move higher, even with fewer closed sales. Homes that are well-located, well-designed, or recently remodeled are commanding strong prices.

Sales Activity

  • Closed sales (Dec): down 25% year over year
  • Year-to-date closed sales: essentially flat

Lower sales volume here is not a sign of weakness—it reflects owners choosing not to sell unless they truly need to. Many homeowners are locked into low interest rates or simply don’t want to give up their location.

Days on Market

  • 38 days in December 2025
  • Faster than the prior year

Well-priced homes in desirable pockets of La Jolla are still moving efficiently.

Inventory & Supply

  • Inventory: 75 homes
  • Months of supply: 3.2 months

This is still considered a tight market, especially for a luxury coastal community. Anything under four months of inventory favors sellers.

Condos & Townhomes in La Jolla (Attached)

The attached market tells a slightly different—but still healthy—story.

Price Trends

  • Median sales price (December 2025): $1,182,500
  • Up 10.0% year over year
  • Flat on a rolling 12-month basis (+0.9%)

Condos experienced stronger price growth earlier in the cycle and are now stabilizing. This segment remains attractive for:

  • Second-home buyers
  • Downsizers
  • Buyers priced out of single-family homes

Sales Activity

  • Pending sales up sharply in December
  • Year-to-date closed sales down slightly (-3.0%)

This suggests buyer interest is returning, even if completed transactions lag slightly.

Days on Market

  • 40 days in December
  • Still very reasonable for a coastal luxury condo market

Inventory & Supply

  • Inventory: 59 units
  • Months of supply: 2.7 months

Condos are actually tighter on supply than detached homes, which helps support pricing.

What This Means for La Jolla Home Sellers

If you own property in La Jolla, especially a single-family home, the market remains in your favor—but strategy matters more than ever.

Key seller takeaways:

  • Buyers are value-driven and educated
  • Overpricing leads to longer market times
  • Proper presentation and marketing are critical
  • Unique homes still command premium pricing

La Jolla buyers are selective, but when a home checks the right boxes—location, condition, views, privacy—they move decisively.

What This Means for Buyers (Local & Out-of-Area)

For buyers, La Jolla in 2026 is about opportunity through patience, not quick bargains.

What buyers should know:

  • Inventory remains limited
  • Pricing is stable to upward, not falling
  • Negotiation is possible—but not guaranteed
  • Off-market and pre-market opportunities matter

Out-of-area buyers often underestimate how little resale inventory comes up in La Jolla. Waiting for a “big correction” has historically meant missing long-term appreciation.

Looking Ahead: La Jolla Real Estate in 2026

As we move further into 2026, several factors will shape the market:

  • Potential interest-rate easing later in the year
  • Continued lack of new construction
  • Strong demand for coastal, walkable communities
  • Ongoing appeal of La Jolla as a long-term lifestyle investment

La Jolla real estate is not about timing the market—it’s about time in the market. History has shown that well-located La Jolla properties continue to perform over full market cycles.

Final Thoughts

La Jolla remains one of San Diego’s most exclusive and resilient real estate markets. While transaction volume may ebb and flow, pricing strength, limited supply, and long-term desirability remain firmly intact.

If you’re considering selling, buying, or simply want a property-specific opinion for your home or neighborhood within La Jolla, a hyper-local approach matters more here than almost anywhere else in San Diego.

San Diego Real Estate

Jan. 27, 2026

Imperial Beach Real Estate Market Update January 2026

Current Real Estate Market in Imperial Beach

A Local Perspective from a San Diego Real Estate Agent with 35+ Years of Experience

Imperial Beach has always marched to its own beat in the South Bay San Diego real estate market. As San Diego County’s southernmost beach community, Imperial Beach offers a rare combination of coastal access, smaller housing stock, and a more laid-back, local feel compared to many North County coastal markets.

Imperial Beach Real Estate 2026 Market Update January

As we move into January 2026, the Imperial Beach real estate market is showing clear signs of adjustment after several years of elevated pricing, tight inventory, and interest-rate volatility. The data from the San Diego MLS gives us a very telling snapshot of where the market stands—and where it may be heading next.

Below is a detailed breakdown of single-family homes and condos/townhomes, what changed from 2024 to 2025, and what it means for buyers and sellers heading into 2026.

Big Picture: A Market Rebalancing, Not a Collapse

Imperial Beach is experiencing what I would describe as a normalizing market. Sales activity slowed in 2025, pricing softened, and homes took longer to sell—but inventory remains relatively tight, especially for single-family homes near the coast.

This is not a distressed market. Instead, it’s a market adjusting to:

  • Higher borrowing costs
  • More price-sensitive buyers
  • Sellers needing to be realistic about value

Single-Family Homes in Imperial Beach (91932)

Sales Activity Is Slower—but Still Moving

For December 2025, single-family homes saw:

  • New listings: Down sharply compared to December 2024
  • Closed sales: Down year-over-year
  • Pending sales: Also lower, reflecting cautious buyer behavior

On a year-to-date basis, closed sales declined by just under 8%, which is modest given the interest-rate environment and affordability challenges buyers faced throughout 2025

Pricing: A Healthy Pullback After Strong Appreciation

  • December median sales price: ~$720,000
  • Down about 7% year-over-year
  • Year-to-date median: ~$850,000 (down ~5%)

This price correction follows several years of very strong appreciation. From a long-term perspective, Imperial Beach values remain well above pre-pandemic levels, and this softening has helped restore some balance between buyers and sellers

Days on Market: Homes Are Taking Longer to Sell

  • December average days on market: ~83 days
  • Up significantly from last year
  • Year-to-date average: ~52 days

This is one of the clearest signs of a changing market. Buyers are no longer rushing, and homes that are overpriced are sitting. Well-priced homes in good condition are still selling—but patience and strategy matter more now than they did a few years ago

Inventory: Still Relatively Tight

  • Active inventory (Dec 2025): 16 homes
  • Months of supply: ~2.1 months

Despite slower sales, Imperial Beach remains a low-inventory coastal market. A balanced market is typically closer to 4–6 months of supply, so this still favors sellers—especially those who price correctly and prepare their homes well

Condos & Townhomes in Imperial Beach

A More Noticeable Shift Than Single-Family Homes

Attached homes in Imperial Beach experienced greater volatility in 2025.

  • Closed sales (YTD): Down ~15%
  • Pending sales: Down nearly 19%
  • Inventory: Increased significantly
  • Months of supply: Jumped to ~5.4 months

This puts the condo and townhome segment much closer to a balanced—or even buyer-leaning—market

Pricing Adjustments Are More Pronounced

  • December median price: ~$715,000
  • Down nearly 25% year-over-year
  • Year-to-date median: ~$649,500 (down ~14.5%)

These numbers look dramatic, but they’re heavily influenced by small sample sizes and shifts in the types of units sold. That said, buyers in early 2026 are clearly more price-conscious, and sellers of attached homes must be realistic to attract activity

Days on Market Improving Slightly

Interestingly, while prices adjusted, days on market for condos actually improved slightly year-over-year, suggesting that properly priced units are finding buyers more efficiently than overpriced ones

What This Means for Buyers in January 2026

If you’re a buyer looking in Imperial Beach:

  • You have more negotiating power than in recent years
  • Price reductions and concessions are more common
  • Condos and townhomes offer particularly good opportunities
  • Inventory is still limited, so desirable homes don’t linger forever

This is a market where preparation matters—financing, local knowledge, and realistic expectations go a long way.

What This Means for Sellers in Imperial Beach

For sellers, the strategy in 2026 is very different than it was in 2021 or 2022:

  • Pricing correctly from day one is critical
  • Overpricing leads to longer days on market and weaker offers
  • Presentation and condition matter more than ever
  • Buyers are comparing everything

The good news: Imperial Beach remains a desirable coastal community, and well-positioned homes are still selling.

Looking Ahead: Imperial Beach in 2026

As we move further into 2026, much will depend on:

  • Mortgage rate trends
  • Buyer confidence
  • Broader economic stability

Imperial Beach’s limited land, coastal access, and community character continue to support long-term value. While short-term fluctuations are normal, the fundamentals remain intact.

Final Thoughts from a Local Perspective

After more than three decades working in San Diego real estate, I’ve seen markets cycle many times. What we’re seeing in Imperial Beach right now is a recalibration, not a retreat.

For buyers, this may be one of the better windows we’ve seen in years. For sellers, success in 2026 comes down to strategy, pricing, and local expertise.

If you’re thinking about buying or selling in Imperial Beach this year, understanding these market nuances is key—and that’s where local experience truly matters.

Call us today 619-656-0655

San Diego Real Estate

Jan. 26, 2026

Downtown San Diego Real Estate Market Update January 2026

Current Market Conditions in Downtown San Diego 

Local insight from a San Diego real estate professional with over 35 years of experience

Downtown San Diego has always been its own animal within the broader San Diego real estate market. It behaves differently than suburban neighborhoods, it reacts faster to interest rate changes, and it is heavily influenced by lifestyle trends, investor behavior, and condo supply. As we move into January 2026, the Downtown market is showing clear signs of stabilization, with pricing holding firm even as sales volume remains muted.

Downtown San Diego Real Estate 2026 Market Update January

This update focuses on ZIP code 92101, which includes Downtown’s core residential neighborhoods such as Gaslamp Quarter, Little Italy, East Village, Marina District, and Columbia District.

All data below is current as of mid-January 2026 and sourced from the San Diego MLS

The Big Picture: A Market Finding Its Floor

Downtown San Diego entered 2025 under pressure. Higher interest rates, rising HOA dues, insurance costs, and investor pullback all slowed activity. What we’re seeing now is not a rebound—but a reset.

Prices are no longer falling meaningfully. Buyers are active again, but they are selective. Sellers who price realistically are selling. Those who chase 2022 pricing are sitting.

This is what a normalizing urban market looks like.

Attached Homes & Condos (The Core of Downtown Living)

Median Sales Price

  • December 2025: $772,500

  • December 2024: $790,000

  • Year-over-Year Change: –2.2%

  • Year-to-Date Median: $725,000 (essentially flat year over year)

Despite headlines about condo weakness nationwide, Downtown San Diego prices have been remarkably stable over the past 12 months. A 2% shift in pricing is well within normal market movement, especially following the volatility of 2022–2024

Sales Activity

  • Closed Sales (December): 28 (down 36.4% year over year)

  • Year-to-Date Closed Sales: 526 (down 12.5%)

Lower sales volume does not equal a collapsing market. What it tells us is that fewer owners are willing to sell unless they truly need to. Many Downtown owners locked in sub-4% interest rates years ago and simply aren’t motivated to move


Days on Market

  • December 2025: 60 days

  • December 2024: 64 days

Homes that are priced correctly and show well are still moving in about two months, which is very reasonable for an urban condo market with higher price points and HOA considerations


Inventory & Months of Supply

  • Active Inventory: 177 units

  • Months of Supply: 4.1 months

This puts Downtown San Diego in a balanced market—not a seller’s market, not a distressed buyer’s market. Buyers have options, but quality listings do not last forever


Detached Homes Downtown: A Small but Telling Segment

Detached single-family homes Downtown represent a very small sample size, but the trends are still worth noting.

  • Median Sales Price (YTD): $1,100,000

  • Down sharply from the prior year due to just a handful of high-end sales skewing earlier data

  • Days on Market: Dropped from 108 to 45 days

  • List-to-Sale Ratio: Jumped to 96.7%

When detached homes do come on the market Downtown—often in areas near Bankers Hill or transitional edges—they are selling faster and closer to list price than last year.

Neighborhood-Level Observations

Little Italy

Still the strongest Downtown submarket. Limited inventory, walkability, dining, and newer construction keep values resilient. Well-located condos here attract both primary residents and second-home buyers.

Marina District

More sensitive to HOA costs and building age, but pricing has largely stabilized. Buyers are negotiating harder here, especially on older towers.

East Village

A tale of two markets: newer buildings with parking and amenities perform well; older or poorly managed buildings struggle. Pricing must be sharp.

Gaslamp Quarter

Primarily lifestyle-driven. Investor interest is lighter than pre-2020, but owner-occupant demand has improved.

What This Means If You Live Downtown

If you’re a homeowner:
Your value has likely stabilized. This is not the market to “test” a high price, but it is a market where realistic pricing gets results.

If you’re thinking of selling in 2026:
Preparation matters more than ever—pricing strategy, staging, HOA disclosures, and timing are critical.

If you’re a buyer:
This is one of the best negotiating windows Downtown has seen in years. You have leverage—but not unlimited leverage.


Looking Ahead to 2026

Downtown San Diego is unlikely to see explosive price growth in 2026—but it also shows no signs of systemic decline. If interest rates ease even modestly, buyer demand could increase quickly due to pent-up urban demand and limited new construction.

This is a market that rewards local knowledge, building-specific expertise, and realistic expectations.

Final Thoughts From a 35-Year San Diego Real Estate Veteran

Downtown San Diego has been written off many times over the decades—and every time, it redefines itself. What we’re seeing now is a quieter, healthier market that favors informed buyers and disciplined sellers.

If you live Downtown, or you’re considering buying or selling in 92101, understanding your specific building and neighborhood matters more than any headline.

San Diego Real Estate

Jan. 25, 2026

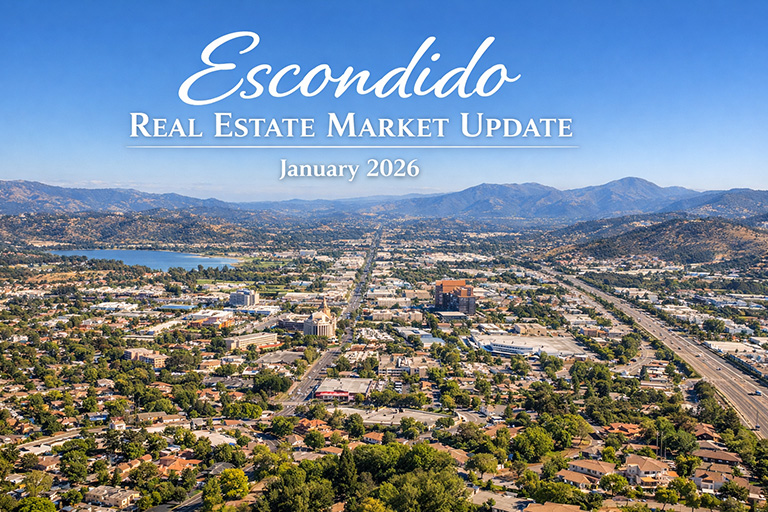
Escondido Real Estate Market Update January 2026

Escondido Inventory Remains Tight, Especially for Well-located Single-family Homes

A Local, Data-Driven Look at Where the Market Stands and What It Means for Homeowners and Buyers

As we move into January 2026, the Escondido real estate market continues to reflect what we’re seeing across much of inland North County San Diego: low inventory, selective buyer demand, and pricing that is highly neighborhood- and property-specific.

Having worked in the San Diego real estate market for more than 35 years, I can tell you this is not a “one-headline” market. Escondido is made up of several distinct sub-markets, and each one is behaving a little differently as we start the new year.

Escondido Real Estate 2026 Market Update January

This report breaks down Escondido South (92025), North (92026), East (92027), and West (92029) using the most recent San Diego MLS data through December 2025, so homeowners and buyers can understand what’s really happening on the ground.

Big-Picture Takeaways for Escondido (January 2026)

Before diving into each area, here are a few themes that stand out across Escondido as a whole:

  • Inventory remains tight, especially for well-located single-family homes
  • Days on market are longer than last year, signaling a more thoughtful buyer pool
  • Pricing is holding up better than many expected, particularly in North, East, and West Escondido
  • Attached homes (condos/townhomes) show more volatility and price sensitivity than detached homes

This is no longer the frenzied market of 2021–2022—but it is also not a distressed market. It’s a more balanced, negotiation-driven environment.

Escondido South (92025): Softer Pricing, More Buyer Leverage

Escondido South saw mixed performance in 2025, particularly between detached and attached homes.

Single-Family Homes (Detached)

  • Median sales price held steady year-over-year at $960,000
  • Closed sales declined slightly, down 7.2%
  • Average days on market increased to 43 days, up from 32 the year before
  • Inventory dropped significantly, keeping months of supply under 2 months

Despite slower activity, pricing for single-family homes has been remarkably resilient, largely due to limited supply

Condos & Townhomes (Attached)

  • Median price declined 8.7% year-over-year
  • Months of supply nearly doubled, moving above 4 months
  • Inventory increased sharply

For buyers, this is one of the more negotiable segments of the Escondido market right now.

Escondido North (92026): Steady Appreciation with Slower Momentum

Escondido North continues to be one of the most stable sub-markets in the city.

Single-Family Homes

  • Median sales price up 9.3% year-over-year to approximately $899,000
  • Closed sales increased 4.1%
  • Days on market rose to 43 days
  • Inventory remains tight at about 1.7 months of supply

This area continues to benefit from strong neighborhood appeal and consistent demand, even as buyers take more time to make decisions

Condos & Townhomes

  • Prices showed modest recovery on a year-to-date basis
  • Sales volume increased, but days on market stretched significantly

Escondido East (92027): Solid Growth, Especially for Detached Homes

Escondido East posted some of the strongest overall performance in 2025.

Single-Family Homes

  • Median price rose to $830,000, up 3.1% year-over-year
  • Closed sales increased nearly 5%
  • Inventory remains very limited, with under 2 months of supply

Homes that are well-priced and in good condition continue to attract strong interest, even with higher borrowing costs

Attached Homes

  • Pricing was more volatile month-to-month
  • Year-to-date median price showed improvement
  • Inventory declined, helping stabilize this segment going into 2026

Escondido West (92029): High-End Market Holds Its Ground

Escondido West remains the highest-priced sub-market in the city and continues to outperform many inland areas.

Single-Family Homes

  • Median sales price increased to approximately $1,385,000
  • Closed sales rose more than 22% year-over-year
  • Inventory is extremely tight at roughly 1.2 months
  • Days on market increased modestly, reflecting careful buyer scrutiny

This area continues to attract buyers looking for larger homes, privacy, and long-term value, even in a higher-rate environment

Condos & Townhomes

  • Very limited sales activity
  • Small sample sizes, but pricing remained relatively stable

What This Means for Buyers and Sellers in 2026

For Homeowners Thinking About Selling

  • Pricing strategy matters more than ever
  • Homes that are well-prepared and realistically priced are still selling
  • Overpricing leads to longer market times and price reductions

For Buyers

  • You have more negotiating room than in prior years
  • Condos and townhomes offer the best opportunities for value
  • Being prepared and decisive still matters in low-inventory neighborhoods

Final Thoughts: Escondido Enters 2026 in a Balanced Market

Escondido is entering 2026 as a measured, data-driven market—not overheated, not distressed. The days of bidding wars are mostly behind us, but quality homes in good locations continue to command attention.

As always, real estate is hyper-local. The difference between Escondido South and West can be dramatic, and even within the same zip code, street-level factors matter.

If you’re thinking about buying or selling in Escondido this year, make sure your decisions are based on current neighborhood data—not headlines.

Contact The Lewis Team today 619-656-0655.

San Diego Real Estate

Jan. 24, 2026

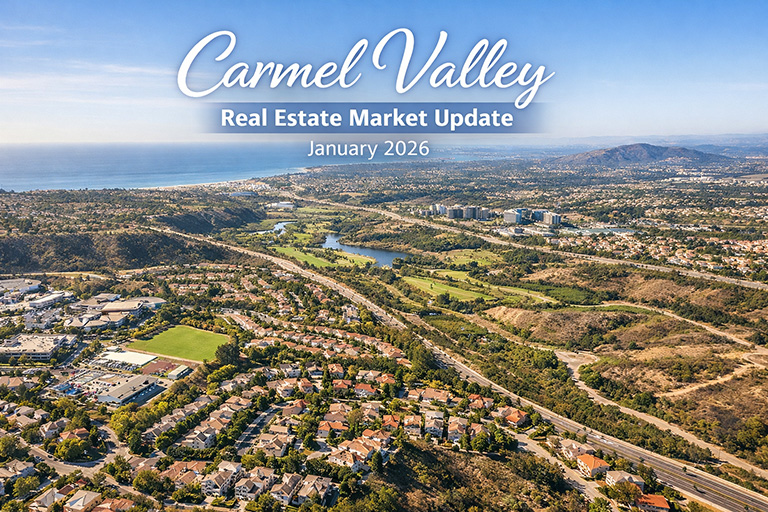
Carmel Valley Real Estate Market Update January 2026

Carmel Valley Homeowners and Buyers Need to Know Going Into 2026

If you live in Carmel Valley, you already know this is one of San Diego’s most consistently desirable coastal-adjacent communities. With its proximity to Del Mar, strong employment centers, newer housing stock, and long-term owner occupancy, Carmel Valley tends to move differently than the broader San Diego market.

As we head into January 2026, the data confirms something many longtime residents are already sensing:
inventory remains extremely tight, pricing is resilient, and buyers are still competing—just more carefully than in previous years.

Carmel Valley Real Estate 2026 Market Update January

Below is a clear, data-driven breakdown of where the Carmel Valley market stands and what it means if you’re thinking about selling, buying, or simply keeping an eye on your home’s value.

Big Picture: Carmel Valley Is Still a Seller-Leaning Market

Despite higher interest rates and economic uncertainty over the past year, Carmel Valley continues to operate as a low-inventory, demand-supported market.

Two things stand out immediately in the January 2026 numbers:

  1. Inventory is exceptionally low
  2. Prices have held up better here than in many other San Diego sub-markets

This combination has kept downward price pressure limited, even as buyers have become more selective.

Single-Family Homes (Detached Properties)

Pricing Trends

  • December 2025 median sales price: $2,301,259
  • Up 11.3% from December 2024
  • Year-to-date median price (rolling): $2,555,000, down slightly (-2.4%) year over year

What this tells us:
Prices surged earlier in the year, then moderated slightly toward year-end. That’s not a sign of weakness—it’s a sign of normalization after strong appreciation.

From a long-term perspective, Carmel Valley single-family home values remain very strong and historically elevated.

Inventory & Supply

  • Homes for sale (Dec 2025): 14
  • Down 44% from last year
  • Months of supply: 0.8 months

Anything under 2 months of inventory is considered a strong seller’s market. Carmel Valley isn’t just under that threshold—it’s well under it.

This is one of the main reasons prices have held firm despite longer days on market.

Days on Market & Negotiation

  • Average days on market: 55 days (up from 34)
  • List-to-sale price ratio: 93.9%

Homes are taking longer to sell, and buyers are negotiating more than they were during the peak frenzy years. However, this is still a measured correction, not a market shift.

Well-priced, well-presented homes continue to sell. Overpriced listings sit.

Condos & Townhomes (Attached Properties)

Pricing

  • December 2025 median price: $988,000
  • Up 12.5% year over year
  • Year-to-date median: $995,000, essentially flat (-0.5%)

Attached homes in Carmel Valley remain highly attractive to:

  • First-time buyers priced out of detached homes
  • Move-down buyers staying local
  • Long-term owners with low turnover

Inventory & Market Speed

  • Homes for sale: 10
  • Months of supply: 0.8 months
  • Days on market: 58 days

Just like the single-family market, attached properties are selling more slowly—but supply remains extremely limited, preventing any meaningful price erosion.

What’s Really Driving the Carmel Valley Market

After decades of watching San Diego cycles, Carmel Valley stands out for a few consistent reasons:

  • Low turnover: Many owners stay long-term
  • Newer housing stock: Fewer functional obsolescence issues
  • Location premium: Coastal access without coastal density
  • Buyer profile: Well-qualified, long-term buyers—not speculative demand

This combination creates price stability even during uncertain economic periods.

What This Means If You’re a Carmel Valley Homeowner

If you’re considering selling in 2026:

  • You still have a pricing advantage due to low inventory
  • Buyers are more price-sensitive, so strategy matters more than ever
  • Presentation, timing, and accurate pricing are critical

This is not a market for “testing” high prices. It rewards realism and preparation.

What This Means If You’re a Buyer

For buyers watching Carmel Valley closely:

  • Inventory remains extremely limited
  • Competition still exists for well-located, turnkey homes
  • Negotiation opportunities are better than they were—but selective

Patience and strong local guidance matter more now than they did a few years ago.

Looking Ahead to 2026

As we move deeper into 2026, Carmel Valley is positioned to remain one of San Diego’s most stable coastal-adjacent markets. While we may see modest price fluctuations, the fundamentals—limited supply and consistent demand—continue to support values.

This is a market shaped more by long-term homeowners than short-term speculation, and that’s exactly why it continues to perform so well relative to other areas.

Final Thoughts

After more than 35 years working in San Diego real estate, Carmel Valley consistently proves to be a low-drama, high-stability market. It doesn’t swing wildly—but it also doesn’t give much ground.

If you want to understand how these numbers apply specifically to your street, your floor plan, or your neighborhood pocket, that’s where real insight starts.

San Diego Real Estate

Jan. 23, 2026

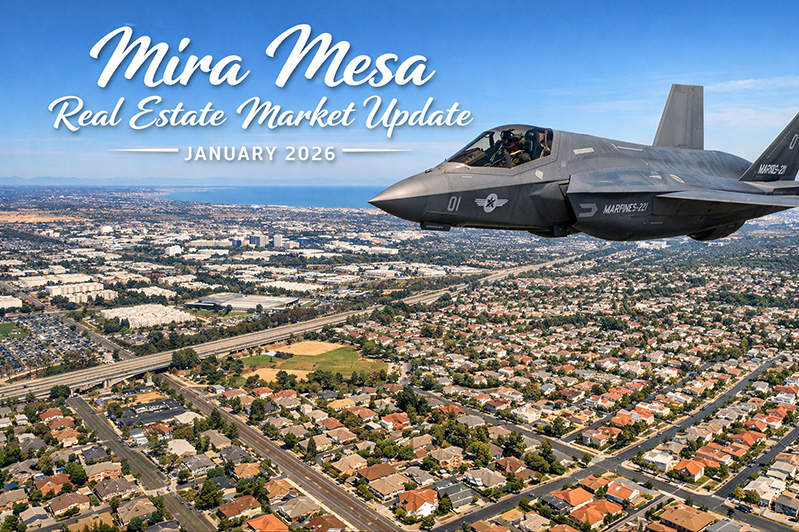
Mira Mesa Real Estate Market Update January 2026

Home and Condo Sales in Mira Mesa CA

North County Inland San Diego | ZIP Code 92126

As someone who has been working in San Diego real estate for more than 35 years, I can say this clearly: Mira Mesa remains one of the most strategically important and resilient housing markets in the county. Its location, employment base, and strong military ties continue to attract both local move-up buyers and out-of-area households relocating to San Diego.

This January 2026 update is based on the latest MLS data through December 2025 and gives a clear picture of where the Mira Mesa market stands as we move into the new year

Mira Mesa Real Estate Market Update January 2026

Why Buyers Continue to Target Mira Mesa

Mira Mesa sits at the crossroads of some of San Diego’s most important employment and lifestyle hubs:

  • Direct access to I-805, I-15, and SR-52
  • Close proximity to Sorrento Valley and UTC tech and biotech employers
  • Minutes from MCAS Miramar, making it a natural fit for active-duty military, civilian defense employees, and VA buyers
  • A large mix of single-family homes, townhomes, and condos, appealing to first-time buyers, investors, and long-term owners

These fundamentals are a big reason Mira Mesa continues to perform even when the broader market slows.

Single-Family Home Market (Detached Homes)

Pricing & Sales Trends

  • December 2025 median sales price: ~$1,185,665
  • Year-over-year December price increase: ~15%
  • Year-to-date median price (2025): ~$1,105,500 (up ~1.2% from 2024)

Prices have stabilized compared to the rapid appreciation of prior years, but they are holding firm at historically high levels, supported by demand and limited resale inventory.

Inventory & Market Pace

  • Inventory: 36 homes (up significantly year-over-year)
  • Months of supply: ~1.9 months
  • Average days on market (YTD): ~28 days

Inventory has increased, giving buyers slightly more breathing room, but this is still a seller-leaning market by any long-term standard. Well-priced homes continue to attract strong interest.

Condos & Townhomes (Attached Homes)

The attached-home segment is especially important in Mira Mesa due to affordability and military buyer demand.

Pricing Snapshot

  • December 2025 median price: ~$732,500
  • Year-over-year December increase: ~32%
  • Year-to-date median price: ~$610,000 (up modestly from 2024)

This segment has seen sharper short-term price movement, largely driven by limited inventory and first-time buyers entering the market.

Inventory & Supply

  • Inventory: 30 units
  • Months of supply: ~2.5 months
  • Average days on market (YTD): ~40 days

While condos and townhomes are taking longer to sell than detached homes, demand remains solid—especially for properties near transit routes and employment centers.

What This Means for Military & VA Buyers

Mira Mesa has long been one of the most VA-loan-friendly markets in San Diego:

  • Competitive pricing relative to coastal communities
  • Short commutes to MCAS Miramar
  • Strong resale demand, which helps protect long-term value
  • A wide range of townhomes and condos that fit VA loan guidelines

For military families relocating from out of area, Mira Mesa often provides the best balance of price, commute time, and neighborhood stability in North County Inland.

Seller Perspective: Strategy Matters in 2026

For homeowners thinking about selling in 2026, the market has shifted into a more price-sensitive environment:

  • Buyers are cautious and well-informed
  • Overpricing leads to longer days on market
  • Homes that are prepared, staged, and priced correctly still sell well

We are no longer in the “list it and name your price” phase—but serious buyers are absolutely active.

Looking Ahead: Mira Mesa in 2026

From my long-term perspective, Mira Mesa is positioned for steady, sustainable performance rather than dramatic swings:

  • Inventory is higher, but still historically tight
  • Interest rate movement will be a key driver of buyer activity
  • Demand from tech, biotech, and military households remains strong

For both buyers and sellers, success in 2026 will come down to good data, realistic expectations, and smart strategy.

Final Thoughts

Mira Mesa continues to be one of San Diego’s most dependable real estate markets—especially for buyers who value location, employment access, and long-term stability. Whether you are a local homeowner, an out-of-area buyer, or a military family relocating to San Diego, understanding these trends is critical before making a move.

Call The Lewis Team today – We’re here for you 619-656-0655

San Diego Real Estate

Jan. 22, 2026

President Trumps Plan to Restrict Institutional Housing Investors and How it Will Affect San Diego Real Estate

What it could mean for San Diego Home Owners and Home Buyers

On January 20, 2026, President Donald Trump signed an executive order titled Stopping Wall Street from Competing with Main Street Homebuyers.” The big idea is straightforward: use federal housing levers to reduce the advantage large institutional investors may have when buying single-family homes, and to push more of those homes toward individual owner-occupants.

President Trumps Plan to Restrict Wall Street Investors and How it Will Affect San Diego Real Estate

For San Diego—where affordability is already a daily challenge—this is worth watching closely.

Investor activity here has been meaningful in recent years: a Redfin analysis previously found investors purchased 23.7% of homes sold in the San Diego metro in Q2 2024, one of the highest shares among major U.S. metros at the time.

Below is a detailed breakdown of what the order directs agencies to do, the timeline, the real-world “so what,” and the specific angles I’d be watching in San Diego County.

1) What the executive order actually does (in plain English)

A) It tells Treasury to define “large institutional investor”

The order doesn’t start by naming a specific company or a fixed unit-count threshold. Instead, it directs the Secretary of the Treasury to develop definitions of:

  • “large institutional investor”
  • “single-family home”

…and to do so within 30 days (in consultation with the White House economic policy team). That definition will matter, because it determines who is “in” or “out” for the rest of the policy.

B) It directs multiple agencies to restrict federal support for purchases by large investors

Within 60 days, several federal entities are instructed to issue guidance designed to prevent (to the maximum extent allowed by law):

  • Federal agencies and Government-Sponsored Enterprises (GSEs) from approving, insuring, guaranteeing, securitizing, or facilitating a large institutional investor’s acquisition of a single-family home that could otherwise be purchased by an owner-occupant.
  • The government from disposing of federal assets in a way that transfers a single-family home to a large institutional investor.

Notably included in the 60-day directive are:

  • HUD
  • VA
  • USDA
  • GSA
  • FHFA (the regulator for Fannie Mae/Freddie Mac)

That list hints at where the policy is likely to bite: federally connected inventory and federally connected financing pathways.

C) It pushes “first-look” and anti-circumvention measures

The order tells agencies to promote sales to individual owner-occupants, including tools like:

  • First-look policies (giving owner-occupants an initial window before investors can buy certain properties)
  • Disclosure requirements
  • Anti-circumvention provisions (aimed at preventing workarounds)

D) It creates a build-to-rent carveout

The order explicitly calls for “narrowly tailored exceptions” for build-to-rent properties that are “planned, permitted, financed, and constructed as rental communities,” plus other limited exceptions agencies may adopt to further the administration’s goals.

This is important: it signals the administration is trying to differentiate between:

  • Buying existing homes that could be owner-occupied, versus
  • Financing/creating purpose-built rental communities (which can add rental supply)

E) It directs antitrust scrutiny of large acquisitions and rental practices

The order directs the Attorney General and FTC Chair to:

  • review substantial acquisitions (including “series of acquisitions”) for anti-competitive effects, and
  • prioritize enforcement where appropriate, including against “coordinated vacancy and pricing strategies” in local single-family rental markets.

That “coordinated vacancy and pricing” language is a big signal: it points to the administration’s framing that large-scale operators can potentially influence rents/availability in specific submarkets.

F) It tightens disclosure for federal housing assistance programs

HUD is directed (as permitted by law) to require owners/managers of single-family rentals participating in federal housing assistance programs to disclose:

  • direct/indirect owners, managers, affiliates, and
  • changes in ownership/control,
    to identify involvement by large institutional investors.

G) It tees up legislation to codify the policy

Finally, it directs White House legislative staff to prepare recommendations so Congress can codify limits, aiming for durability beyond executive action.


2) What this policy does not do (and why that matters)

Even with strong headlines, the order has real limits:

  • It does not create an instant, universal ban on investor purchases. The order is largely about federal program participation and federally linked pathways (like guarantees/securitization) rather than outlawing all-cash or purely private financing.
  • It will likely not stop:
    • an investor buying with cash, or
    • an investor using non-GSE/private financing, depending on how agencies implement guidance.
  • The practical impact will hinge on:
    • the Treasury definitions,
    • the 60-day agency guidance,
    • and whether Congress passes a law with broader reach.

Also, industry data often shows the largest institutional buyers are a small slice of total purchases nationally (even when investor activity overall is higher). NAR has emphasized that when you isolate “corporations and companies only,” the national share was around 3.2% in 2024, and it cites research claiming even “large institutional investors” can be about ~1% of purchases depending on definitions.
That doesn’t mean the effect is zero—it means effects can be highly localized (certain ZIP codes/tracts) rather than evenly spread.


3) Why San Diego should pay attention anyway

San Diego has a few traits that make investor policy changes meaningful even if the “big institutional” slice is smaller than people assume:

A) Investor share has been elevated in the San Diego metro

Redfin’s metro-level analysis showed San Diego near the top of major metros for investor share in 2024 (e.g., 23.7% in Q2 2024).
That figure includes all investor types (not just mega-institutions), but it tells you competition from non-owner-occupants has been real.

B) California’s “big investor” footprint is smaller than many Sun Belt markets—but not zero

CalMatters, citing the California Research Bureau, reported that fewer than 3% of California single-family homes are owned by companies that own at least 10 properties, and about 20,066 homes are owned by firms with portfolios of 1,000+.
So the “Wall Street landlord” story is not evenly California-wide, but it’s still relevant—especially in submarkets where institutional ownership clusters.

C) San Diego’s affordability pressure amplifies small changes

In a market where entry-level buyers are already stretched, even modest shifts in competition or available inventory can affect:

  • days on market,
  • the number of offers,
  • and the “floor” price for clean, entry-level single-family homes.

4) Likely market impacts to watch (pros, cons, and the “it depends”)

Potential upside for owner-occupants (if implementation is strong)

If federal guidance actually reduces investor “fast lanes” on certain homes (especially distressed/foreclosure-related pipelines), you could see:

  • fewer investor offers in specific channels,
  • more “first-look” opportunities for owner-occupants,
  • and potentially less aggressive bidding pressure in the most investor-targeted price bands.

Possible downside: fewer rentals or less investor-funded rehab inventory

Some investors buy homes, renovate them, and bring them to the rental market. If restrictions reduce that flow, we could see:

  • reduced turnover of renovated rentals, or
  • fewer rehabbed homes coming back as rentals.

CalMatters notes research is mixed: converting owner-occupied homes into rentals can increase rental supply (downward pressure on rents) while reducing for-sale supply (upward pressure on prices).
In other words, you can’t change one side without nudging the other.

A key risk raised by skeptics: demand-side boosts without supply-side fixes

Reuters reported investor-side concerns that curbs could raise prices if they boost demand (or shift demand) without adding supply—because the core issue remains constrained inventory in many markets.
San Diego is the poster child for that: supply constraints are structural (land, zoning, costs, permitting timelines).

Build-to-rent carveout could keep new rental construction in play

The order’s explicit exception for build-to-rent communities suggests the administration wants to avoid choking off new rental supply.
If that exception stays narrow but workable, it could mean:

  • less investor demand for existing homes,
  • while still allowing capital to fund new rental communities.

5) The “timeline reality”: what happens next and when this becomes real

Here’s the practical checklist from the order:

  1. Within 30 days: Treasury definition of “large institutional investor” and “single-family home.”
  2. Within 60 days: USDA/HUD/VA/GSA/FHFA guidance on federal program restrictions + first-look/disclosure/anti-circumvention.
  3. Ongoing: DOJ/FTC review of acquisitions and enforcement focus.
  4. Legislation effort: White House prepares recommendations for Congress to codify.

For buyers and sellers in San Diego, the real-world changes will most likely show up as program-level rule changes (and lender/servicer behavior changes that follow) rather than an overnight shift across every listing.

6) What I’d be watching in San Diego neighborhoods

Because the order is about how homes are acquired, the impact won’t be uniform. In San Diego County, I’d watch these “pressure points”:

  • Entry-level single-family pockets where investors historically compete hard (the classic “rent-ready” SFR)
  • Areas with more REO/foreclosure-type inventory when cycles turn (where first-look policies matter most)
  • Submarkets where single-family rentals are a dominant substitute for ownership (family-size rentals)

The more a neighborhood’s for-sale inventory overlaps with “investor-friendly” characteristics—price point, rent ratios, low rehab complexity—the more you might notice changes if the federal guidance is enforced tightly.


7) What this means for San Diego buyers, sellers, and small investors

If you’re a buyer

  • Pay attention to any first-look windows that may emerge in federally connected dispositions (this is exactly what the order calls for).
  • Don’t assume investors disappear—many can still buy with cash or private financing depending on implementation.
  • In San Diego’s tight inventory environment, the bigger driver is still supply, but reduced competition in specific channels can help at the margin.

If you’re a seller

  • For most traditional listings, the immediate impact may be limited (because the order is not a blanket ban on all investor purchases).
  • But if your home is in a segment heavily targeted by investors, watch whether investor offer volume changes after the 60-day guidance is issued.

If you’re a small local investor (1–5 homes, LLC, etc.)

This order is framed at “large institutional investors,” but the definition is pending.
Also, NAR points out that LLC/entity purchases can be substantial overall, while “large institutional” is a smaller slice depending on the definition.
Bottom line: don’t assume you’re affected until Treasury’s definition and agency guidance are published.


8) Bottom line for San Diego: meaningful headline, implementation will determine the real effect

San Diego’s affordability problem is bigger than any single lever. But this order is notable because it’s not just rhetoric—it sets deadlines for definitions and agency guidance, and it directs DOJ/FTC scrutiny in local rental markets.

If the eventual definitions are broad and the guidance meaningfully limits federal facilitation of investor acquisitions, it could open up incremental opportunities for owner-occupants, particularly in any federally connected pipeline and in “starter home” segments where every offer counts. If it’s narrow (or easy to route around via cash/private capital), the impact may be more modest.

Either way, in a supply-constrained market like San Diego, the biggest long-run affordability driver remains building enough housing—and even Reuters coverage of today’s action notes concerns that limiting one buyer class doesn’t solve the underlying shortage.

Thinking about buying or selling, give us a call.

San Diego Real Estate

Jan. 21, 2026

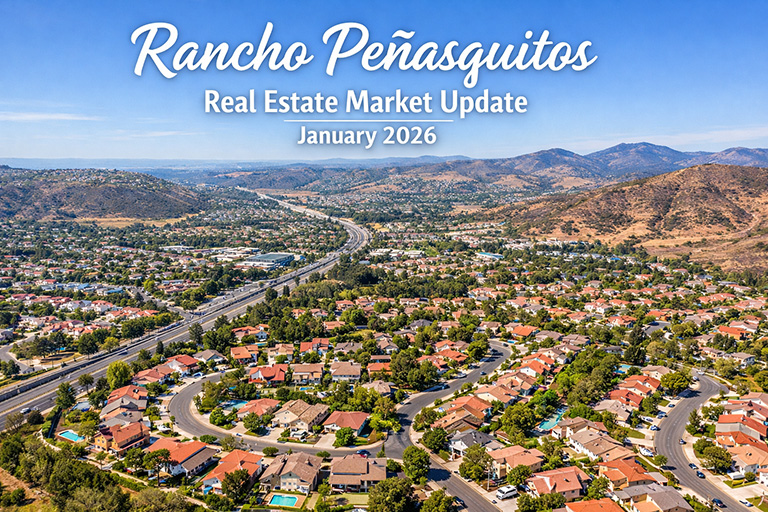
Rancho Peñasquitos Real Estate Market Update January 2026

Early 2026 Statistics for Rancho Peñasquitos Real Estate

Rancho Peñasquitos in North County Inland San Diego ZIP 92129

As a real estate professional with over 35 years of experience across San Diego County, I’ve learned that every community moves to its own rhythm. Rancho Peñasquitos is no exception. I’ve worked with buyers and sellers all over the county for decades, and the data out of Rancho Peñasquitos tells a very clear story as we head into early 2026: inventory remains extremely tight, buyers are still competing for well-priced homes, and pricing has adjusted modestly—not collapsed—after the rapid run-up of the past few years.

Rancho Penasquitos Real Estate 2026 Market Update January

Below is a detailed look at what’s happening locally, using the latest MLS data through December 2025.

Big Picture: A Low-Inventory, Two-Speed Market

Rancho Peñasquitos continues to be a highly desirable North County Inland community thanks to its established neighborhoods, access to open space, and proximity to job centers along the I-15 corridor. What we’re seeing now is a market that has slowed in pace but not in demand.

Buyers are more cautious due to interest rates, yet sellers who price realistically are still finding motivated buyers—often quickly.

Single-Family Detached Homes (92129)

Sales Activity & Inventory

  • Closed sales (YTD) declined from 251 in 2024 to 230 in 2025 (-8.4%), reflecting fewer homeowners willing to sell in a higher-rate environment
  • Inventory is extremely low, with just 0.3 months of supply at year end—well below what would be considered a balanced market
  • December inventory dropped by more than 50% year-over-year, reinforcing how scarce detached homes are in Rancho Peñasquitos

Pricing

  • The median sales price for single-family homes in 2025 came in at $1,450,000, down about 4% year-over-year
  • Even with this modest correction, prices remain historically strong compared to pre-2020 levels.

Days on Market

  • Homes are taking longer to sell, with average days on market increasing from 17 to 29 days year-over-year
  • This shift reflects buyers being more selective, not a lack of demand.

What this means locally:
Rancho Peñasquitos remains a seller-leaning market, but pricing strategy matters more than it did in 2021–2022. Overpricing now leads to longer market times and price reductions.

Condos & Townhomes (Attached Homes)

Sales & Inventory

  • Attached home sales actually increased year-over-year, rising from 86 to 99 closed sales in 2025 (+15.1%)
  • Inventory tightened here as well, with months of supply dropping to around 1.0, down more than 50% from the prior year

Pricing Trends

  • The median attached home price finished 2025 at approximately $685,000, essentially flat compared to 2024 (-0.9%)
  • This segment has become an important entry point for buyers priced out of detached homes.

Days on Market

  • Days on market rose sharply, averaging 40 days year-to-date, up from 22 the prior year

Local takeaway:
Condos and townhomes are absorbing demand from first-time buyers, downsizers, and investors. While they’re taking longer to sell, properly priced units are still moving.

What Buyers Should Know in January 2026

  • Selection is limited. Especially for single-family homes, waiting for “more inventory” has not paid off in Rancho Peñasquitos.
  • Negotiation leverage has improved slightly, particularly on homes that sit longer than 30 days.
  • Attached homes offer opportunity, especially for buyers focused on long-term ownership rather than short-term appreciation.

What Sellers Should Know

  • Low inventory is still your advantage, but buyers are no longer ignoring condition or price.
  • Homes priced correctly from day one are still selling close to list price—often above 98% of original list price on average
  • Preparation, staging, and strong marketing matter more now than at any time in the last five years.

Rancho Peñasquitos: A Community Perspective

Rancho Peñasquitos remains popular with long-time homeowners and move-up buyers because of its mature neighborhoods, proximity to parks and canyon trails, and relative value compared to coastal North County. Many homeowners here are locked into low mortgage rates, which explains why so few are selling—keeping inventory constrained.

Looking Ahead Into 2026

As we move further into 2026, much will depend on interest rate direction. Even a modest decline in rates could quickly bring more buyers into the market, putting renewed upward pressure on prices—especially in communities like Rancho Peñasquitos where supply is already critically low.

Final Thoughts

From my perspective as a San Diego real estate professional with decades of experience, Rancho Peñasquitos is not a market showing signs of distress—it’s a market resetting to a more sustainable pace while maintaining strong long-term fundamentals.

If you’re a homeowner considering selling or a buyer trying to time your move, understanding these local dynamics is critical. Every neighborhood behaves differently, and Rancho Peñasquitos continues to stand out as one of North County Inland’s most resilient communities.

Park Village (West of Black Mountain Rd)

Profile:

  • One of the most established parts of Rancho Peñasquitos
  • Larger lots, mature trees, many original owners
  • Easy access to I-15 and Los Peñasquitos Canyon

Market Behavior (Jan 2026):

  • Detached homes here continue to command top-of-market pricing for the community
  • Homes that are updated sell quickly; dated homes still sell, but buyers negotiate harder
  • Inventory is especially limited—many homeowners are locked into sub-3% mortgages

Seller takeaway:
If your home is even moderately updated, this is still a strong seller position.

Buyer takeaway:
Expect competition on well-located homes; flexibility on condition helps.

Park Village Green (Central PQ)

Profile:

  • Mix of single-family homes and attached properties
  • Popular with first-time buyers and downsizers
  • Close to shopping, schools, and community parks

Market Behavior:

  • One of the most active attached-home submarkets in 92129
  • Condos and townhomes here reflect the broader trend: stable prices, longer days on market
  • Buyers are value-conscious but engaged

Seller takeaway:
Pricing correctly is critical—overpricing leads to sitting.

Buyer takeaway:
This is one of the better areas in Rancho Peñasquitos to find negotiation opportunities.

Rolling Hills / Canyon Rim Areas

Profile:

  • Homes backing or near Los Peñasquitos Canyon Preserve
  • Strong appeal for buyers wanting privacy and open space
  • Fewer sales = more volatile pricing stats

Market Behavior:

  • Canyon-adjacent homes often outperform the ZIP code median
  • Buyers will pay a premium for views and lot location
  • Homes here tend to sell even in slower markets—just not overnight

Seller takeaway:
Your lot matters. Canyon exposure is a major value driver.

Buyer takeaway:
If you want canyon views, be decisive—inventory here is always thin.

Torrey Highlands Border (Southwest PQ)

Profile:

  • Newer construction relative to core PQ
  • Often compared to Torrey Highlands and Carmel Valley
  • Smaller lots but newer layouts and systems

Market Behavior:

  • Prices remain strong due to “newer home” appeal
  • Buyers compare these homes directly with Carmel Valley—often choosing PQ for value
  • Less price softening here than older tracts

Seller takeaway:
Your competition isn’t just PQ—it’s Carmel Valley. Price accordingly.

Buyer takeaway:
This pocket offers some of the best value-per-dollar for newer homes in North County Inland.

Village Center / Paseo Montril Area

Profile:

  • Close to shopping centers, libraries, and transit routes
  • Mix of condos, townhomes, and smaller single-family homes
  • Strong rental demand historically

Market Behavior:

  • Attached homes here remain active due to affordability
  • Investors and long-term holders still show interest
  • Owner-occupant buyers are more cautious but present

Seller takeaway:
Clean, well-presented units still move—even with longer days on market.

Buyer takeaway:
Good long-term hold area, especially if rates ease later in 2026.

What This Means Overall

Even though the Rancho Peñasquitos market as a whole shows:

  • Lower sales volume
  • Slight price adjustments
  • Longer days on market

👉 The best homes in the best micro-locations are still selling well.

In low-inventory markets like this, neighborhood + lot + condition matters more than ZIP code averages.

San Diego Real Estate

Jan. 19, 2026

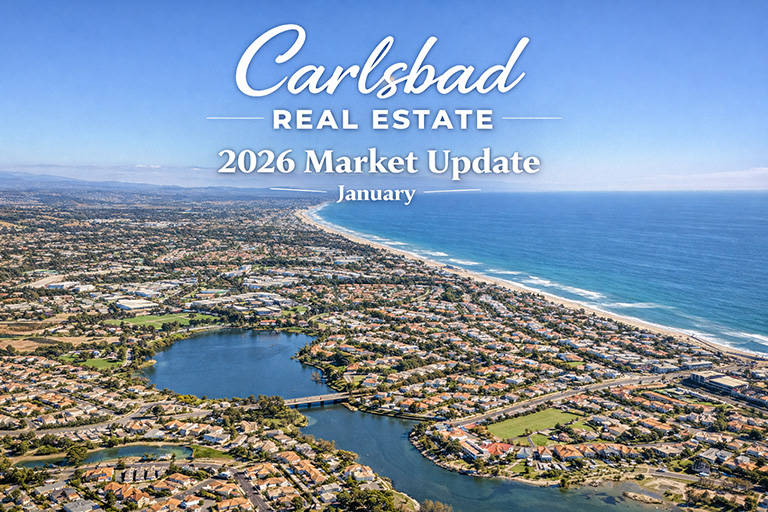
Carlsbad Real Estate Market Update January 2026

Big Picture Carlsbad Real Estate Entering 2026

A Local Real Estate Expert’s Perspective on 92008, 92009, 92010 & 92011

Carlsbad has long been one of North County Coastal San Diego’s most desirable places to live, and as we move into January 2026, that reputation continues to be reflected in the numbers. After more than 35 years selling homes in Carlsbad, I can say this with confidence: low inventory, resilient pricing, and neighborhood-by-neighborhood differences are defining today’s market.

Carlsbad Real Estate 2026 Market Update January

This update breaks down what’s happening right now in the four core Carlsbad zip codes—92008, 92009, 92010, and 92011—and what it means if you live here, are thinking of selling, or are watching the market closely.

All statistics below are sourced directly from the San Diego MLS and reflect data through December 2025, reported in early January 2026.

Big Picture: Carlsbad Entering 2026

Across Carlsbad, we are seeing three consistent themes:

  • Inventory is extremely tight, especially for single-family homes
  • Prices are holding firm, even where sales volume has slowed
  • Well-priced homes still sell, but buyers are more deliberate than they were during the frenzy years

This is not a distressed market. It’s a supply-constrained coastal market, and that distinction matters.

Carlsbad 92008 – Northwest Carlsbad (Village & Coastal Areas)

Northwest Carlsbad includes the Carlsbad Village, older coastal neighborhoods, and areas closest to the ocean always some of the most competitive real estate in the city.

What the Numbers Tell Us

  • Closed sales increased 15.1% year-over-year
  • Median single-family price dipped slightly to $1,865,000 (-0.9%)
  • Inventory dropped by 50%, pushing months of supply down to 1.2 months
  • Homes are taking longer to sell, with days on market up 25%

This zip code remains firmly seller-leaning, despite modest price softening. Buyers are cautious at these price levels, but when a home is well located and properly priced, demand is still there.

Townhomes and condos continue to attract strong interest due to their relative affordability and walkability to the Village core

Local Insight

Carlsbad Village continues to benefit from lifestyle demand—restaurants, the beach, and ongoing improvements. Long-term homeowners here are sitting on substantial equity.

Carlsbad 92009 – Southeast Carlsbad (La Costa & Master-Planned Communities)

92009 covers much of La Costa, known for larger homes, golf courses, and newer developments.

What the Numbers Tell Us

  • Closed sales fell 16% year-over-year
  • Median price rose to $1,962,500 (+3.3%)
  • Inventory collapsed by nearly 64%
  • Months of supply dropped to just 0.5 months

Even with fewer sales, pricing strength tells us something important: sellers are not under pressure. Buyers who want into La Costa are competing over very limited choices.

Attached homes (townhomes/condos) saw sales increase over 13%, offering an entry point for buyers priced out of single-family homes

Local Insight

La Costa continues to attract move-up buyers and families prioritizing space and long-term value. Low inventory suggests strong pricing support going into 2026.

Carlsbad 92010 – Northeast Carlsbad (Older Subdivisions & Central Access)

92010 often flies under the radar but remains a critical part of Carlsbad’s housing mix.

What the Numbers Tell Us

  • Single-family median price jumped 19% in December
  • Year-to-date prices were essentially flat
  • Inventory declined 60%, with months of supply at 0.6
  • Homes sold faster, with days on market dropping significantly

This is a quietly competitive zip code. Fewer sales can cause big percentage swings month-to-month, but the takeaway is clear: supply is extremely limited, and pricing is stable.

Attached homes saw modest softening but faster sales times, suggesting buyers are value-focused rather than price-driven

Local Insight

92010 appeals to buyers wanting central access to the coast, freeways, and employment centers without paying peak coastal premiums.

Carlsbad 92011 – Southwest Carlsbad (Coastal South & Aviara Area)

92011 includes highly desirable coastal neighborhoods and parts of Aviara, where inventory is often the tightest in the city.

What the Numbers Tell Us

  • Single-family inventory dropped 90%
  • Months of supply fell to an almost unheard-of 0.1 months
  • Median prices softened slightly (-1.4%), but remain near $1.9M
  • Homes sold faster, with days on market down nearly 11%

This is a scarcity-driven market. Pricing has flattened slightly, but with almost no homes available, sellers retain strong leverage.

Attached homes showed volatile pricing—common in low-volume coastal condo markets—but inventory remains thin

Local Insight

Homes near the coast or Aviara rarely stay on the market long. Serious buyers are watching closely and moving quickly when something becomes available.

What This Means for Carlsbad Homeowners in 2026

  • If you’re a seller: You are operating in a low-inventory environment. Correct pricing and professional marketing are key, but leverage is still on your side.
  • If you’re a buyer: Choices are limited. Preparation matters—financing, timing, and local knowledge can make the difference.
  • If you’re staying put: Carlsbad home values remain resilient. Even with market shifts, long-term equity trends remain positive.

Final Thoughts from a Local Carlsbad Expert

Carlsbad is not a single market—it’s four very different zip codes, each behaving in its own way. As we enter 2026, the defining factor across all of them is scarcity. When inventory is this tight, real estate becomes hyper-local, and experience matters.

If you want to understand what your specific neighborhood is doing, or how these trends affect your home’s value, that’s where local, boots-on-the-ground insight really counts.

— Written January 2026 by a Carlsbad real estate professional with over 35 years of local market experience. Let The Lewis Team know if you need help buying or selling your home.

San Diego Real Estate

Jan. 16, 2026

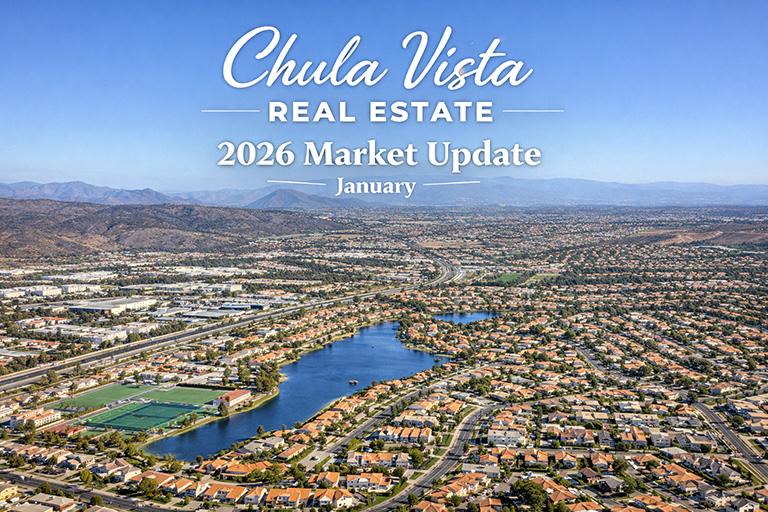
Chula Vista Real Estate Market Update for January 2026

Chula Vista Real Estate for Zips 91910, 91911, 91913, 91914, 91915

If you live in Chula Vista, you probably felt it in 2025: fewer homes to choose from, buyers being more careful, and well-priced properties still getting real attention. The latest MLS market updates (pulled January 5, 2026, reflecting December 2025 results and full-year 2025) confirm exactly that: inventory remains extremely tight across most of Chula Vista, which is helping keep prices relatively stable even as days on market have generally crept up.

Chula Vista Real Estate 2026 Market Update January

Below is a zip-by-zip breakdown of what changed from 2024 to 2025, and what it means going into early 2026.

The quick takeaway for January 2026

Across Chula Vista, the market is being shaped by two forces that seem contradictory but are both true:

  1. Inventory is very low (in several zips the months of supply is around one month or less), which supports prices and keeps competition alive.
  2. Buyers are more selective than they were during peak frenzy years, which shows up in longer days on market in many areas.

In other words: homes don’t automatically sell fast just because it’s a seller-leaning inventory environmentthey sell fast when they’re priced right, prepared well, and marketed correctly.


91910 — Chula Vista North

Detached homes (single-family)

  • Closed sales: 178 in 2025 vs. 186 in 2024 (down ~4.3%).
  • Median sales price: $889,500 vs. $880,000 (up ~1.1%).
  • Days on market (YTD): 35 vs. 32 (slower pace).
  • Months of supply: 0.7 vs. 1.1 (tighter).

Attached homes (condos/townhomes)

  • Closed sales: 112 vs. 111 (flat).
  • Median sales price: $569,450 vs. $568,000 (flat).
  • Months of supply: 1.2 (still low).

What it means locally: 91910 stayed steady on pricing, but the tight supply is the headline. If you’re selling, you still have leverage—just don’t overprice, because buyers are watching the days-on-market metric closely.

91911 — Chula Vista South

Detached homes

  • Closed sales: 196 vs. 209 (down ~6.2%).
  • Median sales price: $819,000 vs. $812,125 (up ~0.8%).
  • Days on market (YTD): 31 vs. 26 (slower).
  • Months of supply: 0.8 (tight).

Attached homes

  • Closed sales: 88 vs. 100 (down ~12%).
  • Median sales price: $600,000 vs. $551,813 (up ~8.7%).
  • Months of supply: 1.7 (more breathing room than other Chula Vista zips).

What it means locally: Detached homes are still constrained by supply. The attached market is where buyers may find the most negotiating room, simply because supply is less tight than elsewhere—though pricing in 2025 still held up.

91913 — Eastlake (one of Chula Vista’s most watched markets)

Eastlake deserves its own section because it tends to behave like a “micro-market” with strong lifestyle demand. Even when rates move, Eastlake often holds up because many buyers are targeting the planned communities, amenities, and overall neighborhood feel.

Detached homes

  • Closed sales: 238 vs. 217 (up ~9.7%).
  • Median sales price: $985,000 vs. $970,000 (up ~1.5%).
  • Days on market (YTD): 34 vs. 27 (slower).
  • Months of supply: 0.7 (very tight).

Attached homes

  • Closed sales: 207 vs. 188 (up ~10.1%).
  • Median sales price: $660,000 vs. $666,500 (down ~1.0%).
  • Months of supply: 0.9 (tight).

What it means in Eastlake: You can see the “2025 reality” clearly here—more closings, stable pricing, but longer time to sell. That usually means demand is there, but buyers are taking longer to decide and comparing options more carefully. In early 2026, Eastlake homes that are clean, well-presented, and priced correctly should still perform well because there simply aren’t many alternatives.

91914 — Chula Vista Northeast (smaller market, bigger swings)

91914 often shows bigger percentage changes because the number of total sales is smaller than the other zips. A handful of transactions can move the stats.

Detached homes

  • Closed sales: 81 vs. 99 (down ~18.2%).
  • Median sales price: $1,307,500 vs. $1,300,000 (up ~0.6%).
  • Days on market (YTD): 48 vs. 31 (notably slower).
  • Active inventory snapshot: 1 active listing shown and 0.1 months supply reported (extremely tight).

Attached homes

  • Closed sales: 27 vs. 38 (down ~28.9%).
  • Median sales price: $651,000 vs. $672,500 (down ~3.2%).
  • Days on market (YTD): 44 vs. 23 (slower).

What it means locally: 91914 is a good example of a market that can feel slower (higher days on market, fewer closings) while still being protected by supply constraints. When inventory is that limited, pricing doesn’t usually collapse—it becomes more sensitive to condition, upgrades, and price positioning.

91915 — Chula Vista Southeast (Otay Ranch influence is strong here)

When locals say “Otay Ranch,” they’re often describing a lifestyle: newer construction feel, planned communities, HOAs/amenities, parks, and commuter convenience. A lot of that demand shows up in the behavior of 91915.

Detached homes

  • Closed sales: 121 vs. 121 (flat).
  • Median sales price: $939,730 vs. $970,500 (down ~3.2%).
  • Days on market (YTD): 33 vs. 29 (slower).
  • Months of supply: 0.4 (very tight).

Attached homes

  • Closed sales: 129 vs. 152 (down ~15.1%).
  • Median sales price: $695,000 vs. $700,000 (down ~0.7%).
  • Months of supply: 0.9 (tight).

What it means for Otay Ranch-style buyers and sellers: The “headline” here is inventory. Even with a modest dip in detached median price year-over-year, the supply is so low that well-prepared homes can still attract strong interest. In my experience, price softening like this often shows up when homes need updates, have functional issues, or are initially priced too high and require reductions.

What this means for early 2026: practical guidance for locals

If you’re thinking of selling in 2026

  • Pricing correctly is everything. Many zips show higher days on market than last year, even when inventory is tight (example: 91913 and 91914).
  • Condition matters more than it did a few years ago. Buyers are comparing monthly payments carefully and they’re less forgiving about deferred maintenance.
  • Low inventory is your friend—if you hit the market “ready.” With months of supply as low as 0.4 in 91915 and 0.7 in 91910/91913, good homes don’t have a lot of competition.

If you’re thinking of buying in 2026

  • Be ready when the right home comes up. Tight supply means the best listings can still move quickly.
  • Your best leverage is usually on:
    • homes that are overpriced and sitting,
    • homes that need cosmetic work,
    • and segments where supply is slightly higher (example: 91911 attached at 1.7 months supply).

Final word: Chula Vista stays supply-driven heading into 2026

When I look across 91910, 91911, Eastlake (91913), 91914, and 91915, the pattern is consistent: inventory constraints are still shaping the market. That’s why pricing has generally remained stable, even with longer selling timelines in many areas.

Neighborhood Notes: What I’m Seeing on the Ground (January 2026)

91910 — Chula Vista North

This area continues to attract long-time homeowners and move-up buyers who value larger lots, mature neighborhoods, and proximity to downtown Chula Vista. Homes here tend to sell best when they’re updated, as buyers are very aware of renovation costs. Single-story homes and properties with ADU potential are getting strong interest due to multigenerational living trends.

91911 — Chula Vista South

91911 remains one of the more affordable entry points into Chula Vista for both detached and attached housing. Buyers here are value-driven and payment-sensitive, which explains why homes that are priced even slightly above market tend to sit longer. Well-maintained homes near parks, shopping, and transit continue to outperform the broader zip code averages.

Eastlake (91913) — Still One of Chula Vista’s Strongest Lifestyle Markets

Eastlake continues to behave like its own micro-market. Demand remains steady for planned communities, HOA amenities, golf-course proximity, and school-centric neighborhood layouts.

  • Eastlake Greens & Eastlake Trails: Homes that back to open space, golf course, or trails typically sell faster and closer to list price.
  • Eastlake Woods / newer pockets: Buyers here expect turn-key condition; cosmetic upgrades matter more than ever in 2026.

Even with longer days on market compared to a few years ago, Eastlake’s low inventory is still protecting values when homes are positioned correctly.

91914 — Chula Vista Northeast

This is a smaller, higher-price pocket where stats can swing month-to-month simply due to low sales volume. Buyers tend to be very selective here, which explains the longer marketing times. Homes with views, newer construction elements, or unique layouts continue to command attention, while dated properties require sharper pricing to move.

Otay Ranch Influence (Primarily 91915, with overlap into nearby areas)

When people talk about Otay Ranch, they’re often talking about a newer-home lifestyle rather than a strict zip code.

  • Strong appeal for buyers seeking master-planned communities, parks, walking trails, and newer resale homes
  • HOA fees are a bigger part of buyer decision-making in 2026, especially with higher overall housing costs
  • Homes that are clean, staged, and competitively priced continue to sell despite slightly softer year-over-year pricing in some segments

Inventory here is extremely limited, which keeps competition alive even when buyers are cautious.

91915 — Chula Vista Southeast

This area remains popular with families, military-connected buyers, and move-up homeowners. Detached homes that need little work perform best, while those requiring updates tend to see longer market times. Attached homes remain competitive due to limited supply, especially for newer or end-unit townhomes.

Local Perspective Going Into 2026

Across Chula Vista neighborhoods, the biggest difference between homes that sell quickly and those that don’t is price alignment with current buyer expectations, not location. Inventory is still low enough that demand hasn’t disappeared — buyers are simply more careful.

Interested in buying a home in Chula Vista or selling a home in Chula Vista, contact The Lewis Team today!

San Diego Real Estate