San Diego Real Estate Blog

San Diego Real Estate Blog - Real Estate News and Information in San Diego County California - Blog about Real Estate in San Diego County California


Jan. 14, 2026

Rancho Bernardo Real Estate 2026 Market Update January

Rancho Bernardo Homes and Condos in Early 2026 Zip Codes 92127 and 92128

A 12-Month Look Back from December 2024 to December 2025

Rancho Bernardo Real Estate 2026 Market Update January

As we step into early January 2026, the Rancho Bernardo real estate market reflects a year defined by tight inventory, selective buyer demand, and meaningful price adjustments—especially at the higher end of the market. After more than three decades working in San Diego real estate, I can say this past year was less about momentum and more about precision. Homes that were priced correctly sold. Those that weren’t sat longer or adjusted.

This update breaks down exactly what changed from December 2024 to December 2025, with a close look at Rancho Bernardo West (92127) and Rancho Bernardo East (92128), and how detached and attached homes performed in each area.

Big Picture: What Defined Rancho Bernardo in 2025

Across both zip codes, several consistent themes emerged:

  • Inventory declined sharply, pushing months of supply well below balanced-market levels
  • Closed sales fell year-over-year, despite periodic bursts of buyer activity
  • Prices softened modestly overall, with sharper corrections in luxury segments
  • Days on market increased, signaling more cautious, deliberate buyers

This was not a distressed market—but it was a price-sensitive one.

Rancho Bernardo West (92127)

Detached Homes: Luxury Segment Reset

Rancho Bernardo West includes many newer, larger, and higher-priced homes, and that segment saw the most noticeable recalibration in 2025.

Key Year-Over-Year Changes (Dec 2024 → Dec 2025):

  • Closed Sales:
    271 → 254 (-6.3%)
  • Median Sales Price:
    $2,275,000 → $2,150,000 (-5.5%)
  • Pending Sales:
    285 → 252 (-11.6%)
  • Days on Market:
    28 → 41 (+46.4%)
  • Percent of List Price Received:
    99.0% → 96.8%

What this tells us:
High-end buyers remained active, but they were far more selective. Price reductions became common, concessions increased, and sellers had to meet the market rather than test it. Even so, inventory collapsed—December inventory dropped more than 57%—which prevented deeper price declines

Attached Homes: Quiet Stability

Attached homes in 92127 told a very different story.

  • Median Price:
    $795,000 → $800,000 (+0.6%)
  • Closed Sales:
    148 → 108 (-27.0%)
  • Days on Market:
    28 → 30 (essentially flat)
  • Months of Supply:
    Remained near 1.3 months

Despite fewer sales, prices held firm due to extremely limited inventory and continued affordability relative to detached homes.


Rancho Bernardo East (92128)

Detached Homes: Gradual Softening, Still Competitive

Rancho Bernardo East remains one of the most consistently active submarkets due to its mix of established neighborhoods and price accessibility.

  • Closed Sales:
    320 → 310 (-3.1%)
  • Median Sales Price:
    $1,207,000 → $1,181,500 (-2.1%)
  • Days on Market:
    22 → 34 (+54.5%)
  • Inventory:
    Down more than 50% by December 2025

Prices adjusted modestly, but demand never disappeared. Well-presented homes still sold, just not instantly.

Attached Homes: One of the Strongest Segments

Attached housing in 92128 was one of the steadiest performers in all of Rancho Bernardo.

  • Median Sales Price:
    $670,000 → $676,500 (+1.0%)
  • Closed Sales:
    279 → 283 (+1.4%)
  • New Listings:
    Up 33.2%, helping absorb buyer demand
  • Days on Market:
    Increased from 29 → 39 days

Even with longer market times, prices continued rising, supported by downsizing buyers, retirees, and first-time purchasers priced out of detached homes

Inventory: The Defining Factor Going Into 2026

Across both zip codes and all property types, months of supply hovered between 0.6 and 1.3 months by year-end. That is deep seller-market territory, even with softer pricing.

This is the key reason Rancho Bernardo avoided the sharper corrections seen in other parts of San Diego County.

What This Means for Buyers and Sellers in Early 2026

For Sellers

  • Pricing must be accurate from day one
  • Overpricing leads to longer market times and eventual reductions
  • Inventory is still on your side—but buyers are informed

For Buyers

  • Fewer homes to choose from, especially in desirable neighborhoods
  • Negotiation leverage exists only when a home is mispriced or stale
  • Well-priced listings still attract competition

Final Thoughts From a 35-Year Local Perspective

The Rancho Bernardo market in early 2026 is healthy, disciplined, and inventory-starved. We are no longer in a frenzy, but we are far from a downturn. The past year showed us that pricing realism matters—but so does scarcity.

For homeowners considering a move in 2026, strategy matters more than timing. And for buyers, patience and preparation remain essential in one of San Diego’s most enduring communities.


San Diego Real Estate

Jan. 13, 2026

San Diego Real Estate Market Snapshot 2026 January

December 2025 Data What It Signals for 2026

San Diego’s housing market is heading into 2026 with a familiar (and powerful) theme: inventory is tight, pricing is holding firm, and the “pace” of the market depends heavily on interest rates and consumer confidence. The December 2025 Monthly Snapshot (San Diego MLS, current as of January 5, 2026) gives us three headline numbers that tell the story clearly.

San Diego Real Estate 2026 January Very Low Inventory of Homes and Condos for Sale

The three key one-year changes (all property types)

From page one of the report, here are the year-over-year changes for All Properties:

  • Closed Sales: down 6.3%
  • Median Sales Price: up 3.0%
  • Homes for Sale (Active Inventory): down 50.6%

If you only read one paragraph, read this: Sales volume fell, prices rose, and inventory got cut in half. That combination is the clearest explanation for why San Diego can feel “slow” in activity while still remaining “strong” in values.

1) Closed sales down 6.3%: demand didn’t disappear — the market’s flow got restricted

A 6.3% decline in closed sales year-over-year tells us fewer transactions completed, but it does not automatically mean the market is weak.

In a low-inventory environment, closings often fall for two reasons:

A) Fewer homes are available to buy

When the number of homes for sale drops as dramatically as it did (more on that below), the market’s “capacity” shrinks. Even when motivated buyers are present, there are simply fewer acceptable options to purchase.

B) The market becomes more rate-sensitive

San Diego buyers are payment-driven. When rates rise, many buyers pause; when rates ease, many buyers re-enter—fast. That creates “start/stop” behavior that can reduce total annual closings even when prices are steady.

What this tends to mean for 2026:
If inventory stays low (likely), closed sales in 2026 will be heavily influenced by two swing factors:

  • whether mortgage rates trend lower, and
  • whether consumer confidence improves amid global uncertainty.

2) Median sales price up 3.0%: the market still has pricing power

Despite fewer closed sales, the median sales price rose 3.0% year-over-year for all properties. That is a big clue about “where the leverage” is in San Diego:

A) Low supply puts a floor under prices

When homeowners don’t list (or can’t afford to give up a low mortgage rate), supply stays constrained. That tends to reduce the chance of broad price declines because buyers compete for a small pool of quality homes.

B) San Diego is a “sticky” pricing market

Even in slower periods, many sellers in San Diego don’t need to sell. That matters because discretionary sellers often choose to wait rather than cut aggressively—especially when they have strong equity positions and fixed low payments.

What this tends to mean for 2026:
If rates ease and more buyers return, pricing pressure can reappear quickly—not necessarily across every neighborhood equally, but especially in well-located, move-in-ready homes and properties with desirable features (views, lot size, ADU potential, walkability, etc.).

3) Homes for sale down 50.6%: this is the headline that shapes everything

The most important number on page one is the inventory shift: Homes for Sale down 50.6% year-over-year (all properties).

A decline of this size is market-moving. It impacts:

  • buyers (fewer choices, more competition on the “good ones”)
  • sellers (stronger negotiating position when the home is priced correctly)
  • prices (supportive environment, because scarcity creates leverage)
  • days on market (often splits: great homes move fast; “compromises” sit)

And it also explains the contradiction many people feel:

  • “It doesn’t seem that busy,” and also
  • “Prices aren’t really coming down.”

With inventory reduced this sharply, the market can feel quieter simply because fewer homes are available to transact—yet prices can still rise because the supply-demand balance stays tight.

What this points to in 2026: low inventory + uncertainty + the rate wildcard

Heading into 2026, I’d frame San Diego’s market outlook like this:

1) Inventory is likely to remain low (unless something forces more listings)

The data already shows an extremely constrained environment, and this is often reinforced by the “lock-in effect” — homeowners holding onto low mortgage rates and choosing not to sell unless they have a strong life reason. With homes for sale down 50.6%, the baseline expectation is a continuing shortage unless a major catalyst changes seller behavior.

2) Global events and economic uncertainty are the “confidence” variable

Uncertainty tends to delay decisions—especially for discretionary buyers and sellers. In 2026, confidence could be affected by global events, inflation expectations, employment trends, and market volatility. When confidence drops, activity slows. When confidence rises, activity rebounds.

3) Lower interest rates could spark demand quickly

Rates are the accelerant in San Diego. If interest rates move lower, a few things usually happen fast:

  • buyers who paused re-enter the market,
  • purchasing power improves,
  • demand concentrates on the best inventory first,
  • competition increases—often before inventory has time to rebuild.

In a market where inventory has already been cut in half, lower rates can create a quick shift from “patient buyers” to “urgent buyers.”

Practical takeaways for San Diego buyers and sellers in early 2026

If you’re buying in 2026

  • Expect limited options and be ready to act when the right home appears (inventory is the constraint, not demand).
  • Watch rates closely. If rates drop meaningfully, you may see more competition almost immediately.
  • Strong preparation matters: underwriting, clear terms, and knowing your “must-haves vs. nice-to-haves” before you shop.

If you’re selling in 2026

  • A low-inventory environment can be a major advantage if your home shows well and is priced realistically.
  • The market can be less forgiving on homes that feel overpriced or need substantial work—buyers may have fewer choices, but they’re still value-conscious.
  • Timing can matter: if rates soften, demand can rise quickly, often improving showing traffic and offer quality.

Bottom line: 2026 is shaping up to be a “tight-supply market” with a rate-driven upside

The page-one metrics tell a consistent story:

  • Closed sales down (–6.3%) suggests a market that’s been constrained in transaction volume.
  • Median price up (+3.0%) shows San Diego still has pricing resilience.
  • Inventory down (–50.6%) is the core driver—this is what keeps the market supported and sets the stage for a potential demand surge if rates fall.

If 2026 delivers lower interest rates, San Diego has the ingredients for a more active market—even with global uncertainty—because demand doesn’t need to explode to create competition. With inventory this limited, it only takes a modest increase in buyer urgency to spark noticeable movement.

San Diego Real Estate and Homes

Jan. 12, 2026

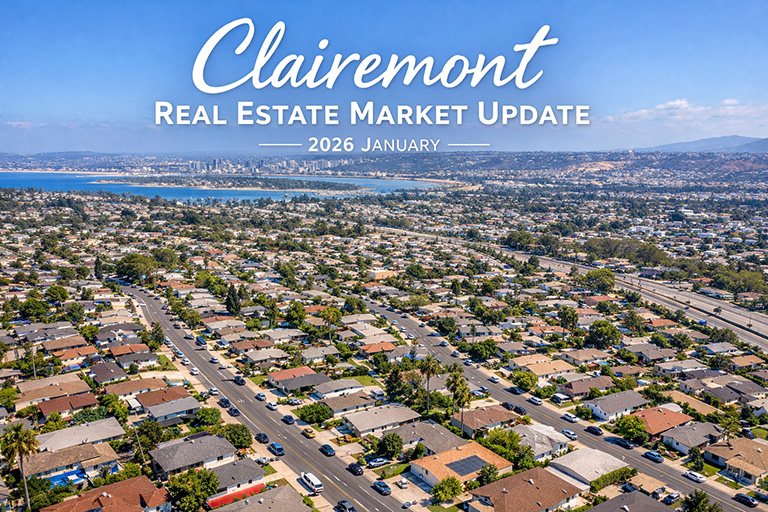
Clairemont Real Estate Market Update 2026 January

Single-Family Homes Year in Review 2025 & Where the Market Stands in January 2026

Clairemont, located in coastal central San Diego, continues to be one of the most resilient and supply-constrained single-family home markets in the county. Known for its mid-century neighborhoods, proximity to beaches and employment centers, and relative affordability compared to coastal luxury submarkets, Clairemont remains highly competitive even in shifting market conditions.

Clairemont Real Estate 2026 Market Update January

Below is a data-driven look at Clairemont single-family detached homes based on San Diego MLS data through December 2025, along with context for how the market is shaping up as we move into January 2026.

2025 Clairemont Single-Family Home Market: Key Takeaways

📈 Sales Activity Increased Despite Market Headwinds

In 2025, Clairemont saw 352 closed single-family home sales, up 11.4% from 2024. Pending sales were also higher year-over-year, signaling steady buyer demand throughout the year even as interest rates remained elevated for much of 2025

This is an important point: while many markets across California experienced slowing activity, Clairemont continued to move homes at a healthy pace, largely due to limited inventory and strong owner-occupant demand.

💰 Home Prices: Slight Annual Softening, Still Near Record Levels

  • 2025 Median Single-Family Sales Price: $1,185,000
  • Year-over-Year Change: –1.8%

While the median price edged slightly lower compared to 2024, values remain historically high and well above pre-2022 levels. This modest price adjustment reflects:

  • Higher borrowing costs through much of 2025
  • Buyers becoming more selective on condition and pricing
  • Increased days on market compared to the frenzied pace of prior years

Importantly, this is not a price collapse—it’s a normalization at elevated price levels.

⏱️ Homes Took Longer to Sell — But Still Moved Quickly

  • Average Days on Market (2025): 25 days
  • Up 13.6% year-over-year

Homes are taking slightly longer to sell, giving buyers more breathing room. That said, a 25-day average is still considered fast by historical standards, especially for a coastal-adjacent San Diego neighborhood.

Well-priced, well-presented homes continued to sell quickly, while homes needing updates or priced aggressively took longer to secure offers.

🏷️ Negotiations Increased Modestly

  • Percent of Original List Price Received (2025): 97.6%
  • Down from 100.5% in 2024

This shift reflects a more balanced negotiation environment. Buyers gained modest leverage in 2025, particularly on properties that were not turnkey. However, sellers who priced correctly still achieved strong results.

🚨 Inventory: The Story That Matters Most

Extremely Low Supply Entering 2026

One of the most striking data points is inventory:

  • December 2025 Active Listings: 11 homes
  • Months of Supply: 0.4 months

This represents a severe seller-leaning market and explains why prices have remained resilient despite affordability challenges.

For context:

  • A balanced market typically has ~5–6 months of inventory
  • Clairemont is operating at less than one month

This level of supply means even a small increase in buyer demand can quickly reignite upward pressure on pricing.

January 2026 Outlook: What to Expect Next

As we move into early 2026, several factors are shaping the Clairemont single-family market:

🔹 Inventory Remains the Limiting Factor

Many homeowners are locked into mortgage rates well below today’s levels, discouraging move-up or discretionary selling. This continues to restrict new listings.

🔹 Interest Rate Volatility Creates Pent-Up Demand

Should interest rates ease in 2026—as many economists anticipate—buyer demand could accelerate quickly. With inventory already near record lows, even a modest rate drop could lead to renewed competition.

🔹 Clairemont’s Location Keeps It in Demand

Compared to coastal submarkets like La Jolla or Pacific Beach, Clairemont offers:

  • Larger lots
  • Detached homes under typical coastal price points
  • Central access to job hubs and freeways

That value proposition remains attractive to both families and long-term homeowners.

Bottom Line

The Clairemont single-family home market exited 2025 strong and enters 2026 extremely supply-constrained. While price growth cooled slightly last year, fundamentals remain solid:

  • Sales volume increased
  • Inventory is critically low
  • Buyer demand remains steady
  • Pricing remains near historic highs

For homeowners, Clairemont continues to be a high-equity, low-risk hold. For buyers, opportunities still exist—but pricing strategy, patience, and local expertise matter more than ever.

If you’re considering buying or selling a home in Clairemont in 2026, understanding hyper-local data—not just countywide headlines—will be key.

San Diego Real Estate

Jan. 11, 2026

San Diego Rent vs Buy in 2026 and Why This Is a Good Time to Buy

Lower Interest Rates in 2026 May Get Buyers Off the Fence

San Diego’s housing landscape continues to challenge both renters and buyers — but with interest rates dipping below 6%, the equation is shifting in favor of homeownership. Below, we’ll break down typical rent costs, what buying looks like with today’s rates, and how they stack up month-to-month.

Renting vs Buying in San Diego 2026

🏘️ San Diego Rental Snapshot (2025–2026)

Here’s what renters are paying locally:

  • Average rent in San Diego: about $3,000 per month across all unit types. 
  • One-bedroom average: roughly $2,375–$2,950/month.
  • Two-bedroom average: around $3,000+.

Rents have remained elevated compared to the national average — about 50% higher — reflecting San Diego’s strong rental demand and limited housing turnover.

🏡 Buying in San Diego: Typical Home Prices

Home prices in late 2025 and going into 2026 look like this:

  • Median home value in San Diego: roughly $910,000 – $970,000.
  • Some trend data shows typical median sale prices around $916,000.

Given supply dynamics, some neighborhoods run above and some below these averages — but these figures give a good baseline.

💰 Monthly Cost Comparison

Let’s compare typical monthly costs based on a 30-year fixed mortgage at ~6% (reflecting the new below-6% rate environment) versus average rent.

📌 Renting

Item

Midpoint Cost

Average Rent (all types)

      $3,000/month

One-bedroom average

   ~$2,375–$2,950/month

Renters pay this amount without building equity — and local rents have remained strong even as some markets cool.

🏠 Buying Example

Assume you purchase a home at $920,000 with 20% down and a 6.0% interest rate.

  • Loan amount: $736,000
  • Interest rate: ~6.0% (now under the 6% threshold in parts of the market)
  • Monthly P&I: approx $4,413 (not including taxes/insurance)

Even though the monthly payment before tax & insurance shows a larger number than rent, there are some important ownership advantages:

You are building equity instead of paying landlord profit.
Mortgage interest and property taxes may be tax deductible for many buyers (consult your CPA).
Principal repayment accelerates long-term net worth.
In a stable or appreciating market, your home can grow in value.

Note: With a lower interest rate — even a half-point improvement — monthly payments can drop significantly. For example, at 5.5%, that similar mortgage would be roughly $4,185/mo, improving affordability.

📊 Affordability Dynamics in San Diego

San Diego remains one of the more expensive U.S. housing markets — but prices have cooled slightly year-over-year while rents remain high:

  • Home prices have moderated, with some data showing slight declines or flat movement in recent months.
  • Rents remain elevated and stable, with limited softening.

That means the gap between owning and renting isn’t just about monthly numbers — it’s about long-term financial positioning.

📈 Why Lower Interest Rates Matter So Much

Here’s the critical piece: each percentage point you reduce your mortgage rate significantly increases your monthly buying power.

With rates now touching below 6% again, buyers with solid credit profiles find:

Lower monthly mortgage payments
Greater ability to qualify for larger loans
Better long-term leverage if rates dip further and refinancing becomes an option

In fact, recent data shows buyers with a budget of $3,000 per month can now typically qualify for a larger home than they could just a year ago — which speaks directly to how lower rates improve purchasing power.


📌 So Should You Rent or Buy in 2026?

As your local San Diego real estate expert, here’s a practical take:

Renting

  • Lower upfront costs
  • Flexibility in relocation
  • No maintenance or property tax responsibilities

Buying

  • Building home equity over time
  • Monthly payments can stabilize (especially if you lock a rate below 6%)
  • Tax advantages
  • Ownership of a physical, appreciating asset

If you plan to stay in the area for 5+ years, even at today’s prices, buying often becomes more financially favorable than renting — especially as mortgage rates settle and potential price recovery resumes.


Bottom Line

While renting may feel cheaper month-to-month today, homeownership in San Diego now looks comparatively stronger thanks to:

Lower interest rates improving buying power
Slight cooling or stabilization in home prices
Continued strength in rent markets

Getting into a home while interest rates are cooling can set you up for long-term financial gain, not just short-term savings.

San Diego Real Estate 2026

Jan. 10, 2026

Interest Rates Dip Below 6% and What That Means for San Diego Homebuyers in 2026

The 30-year fixed mortgage rate touched 5.99%, dipping below 6% for the first time in years

For the first time in nearly three years, U.S. mortgage interest rates have dipped below the psychologically important 6% threshold — and that’s big news for homebuyers here in San Diego. After a long stretch of elevated rates that kept many would-be buyers on the sidelines, the start of 2026 is shaping up to be a renewed moment of opportunity for those ready to take the leap into homeownership.

San Diego Real Estate Interest Rates Drop in 2026

📉 A Turning Point in Mortgage Rate Trends

Mortgage rates have been slowly easing since mid-2025 after climbing to multi-decade highs. According to recent national data, the 30-year fixed mortgage rate touched 5.99%, dipping below 6% for the first time in years — driven in part by broader financial market moves that lowered yields on mortgage-backed securities.

Even though most weekly averages — like Freddie Mac’s latest Primary Mortgage Market Survey — still hover slightly above 6% (around 6.16%), this new below-6% movement is a strong signal of easing borrowing costs for buyers and refinancers alike.

🏡 Why Lower Rates Matter Right Now

Interest rates are one of the biggest levers on monthly mortgage payments. Even a drop of 0.25%-0.50% can shave hundreds off a monthly payment and unlock homeownership for buyers who were previously priced out of the market.

Here’s a simplified example:

  • At a 6.5% interest rate, a $700,000 mortgage carries a significantly higher monthly principal & interest payment than at a 6% rate — easily several hundred dollars more per month depending on term and loan structure.
  • That difference can be enough to bring a payment back into a buyer’s budget and free up room for other costs like taxes, insurance, HOA dues, and maintenance.

For San Diego Home Buyers — where home prices are above the national median — every basis point counts toward affordability and getting into the neighborhood and floorplan you really want.

📊 What Buyers in San Diego Are Seeing

San Diego remains one of the more competitive housing markets in California. Inventory levels continue to be tight, with strong demand from both local buyers and out-of-state movers attracted to our coastal lifestyle and robust employment market.

Now that rates are showing signs of easing:

  • Monthly housing payments become more approachable for first-time and move-up buyers.
  • Potential buyers who were waiting on the sidelines may feel more confident submitting offers.
  • Refinancing becomes worthwhile for existing homeowners who locked in much higher rates over the past couple of years.

Even if rates don’t stay below 6% consistently all year, low-to-mid-6% financing is historically favorable compared to where we were in recent years — and well below the peak averages seen in late 2022 and 2023.

🗓 Should You Buy Now or Wait?

That’s the million-dollar question I get every day here in San Diego. And while timing the absolute bottom of mortgage rates is nearly impossible, here’s a practical way to think about it:

If you plan to live in the home long term:
Interest rates under 6.5% today — and the possibility of refinancing later if rates drop further — makes buying this year a smart move. Over the life of a 30-year loan, the sooner you lock your principal and build equity, the better.

If you’re a more price-sensitive buyer:
Lower rates improve your purchasing power now, so waiting for a few more rate improvements isn’t a bad strategy — but waiting for an ideal rate and stable prices isn’t guaranteed.

The reality in markets like ours is that inventory is still a challenge, and price growth hasn’t pulled back sharply enough to offset higher carrying costs for too many buyers.

📍 San Diego’s Spring Market Could Heat Up

With mortgage rates calming and buyer confidence improving, we’re watching signs that early 2026 could usher in a stronger spring market here in San Diego. Buyers who act when rates dip, even briefly below 6%, could catch the market at a more advantageous moment.

If you’d like a personalized payment estimate or a breakdown of how today’s rates translate into monthly payments on homes in your preferred San Diego neighborhoods, just let me know — I’d be happy to run the numbers with you.

San Diego Real Estate

Jan. 8, 2026

San Diego Single Family Real Estate Forecast for 2026

What Will 2026 Bring for the San Diego Real Estate Market

Predictions for Detached homes + “attached” single-family alternatives like townhomes/condos

San Diego’s housing market heads into 2026 with a familiar mix of forces: high prices, limited supply, and buyers who are extremely payment-sensitive. The big difference versus the last couple of years is that borrowing costs are no longer climbing—and that alone can change behavior, even if rates don’t “crash” lower.

Below is a data-based outlook for 2026 that separates single-family detached from single-family attached (townhomes/condos), because the two segments often react differently to rates, affordability, and inventory.

San Diego Real Estate 2026 Market Predictions

Where San Diego is starting 2026: the market’s “baseline”

Before predicting 2026, you have to anchor to the latest measurable reality.

San Diego County (MLS-based snapshot)

From the Greater San Diego Association of REALTORS® market report (data current as of early January 2026), December 2025 closed with:

  • Detached median sales price: $1,050,000 (up 5.0% YoY)
  • Attached median sales price: $680,000 (up 3.0% YoY)
  • Inventory (end of month): Detached 1,027 (down 54.7% YoY), Attached 849 (down 44.5% YoY)
  • Days on market (until sale): Detached 44 (+10% YoY) and Attached 38 (+24.4% YoY)
  • Months of supply (December): about 1.3 months (very tight)

What that tells us: even with longer market times, San Diego is still operating in a low-supply environment—more “tight and selective” than “loose and falling.”

The 5 drivers most likely to shape 2026

1) Mortgage rates: lower helps, but “back to 3%” isn’t the base case

As of January 8, 2026, Freddie Mac’s weekly survey put the average 30-year fixed at about 6.16%.
Major forecasts generally expect rates to hover around the low-6% range rather than plunge. For example, C.A.R.’s statewide forecast projects an average 30-year fixed around 6.0% in 2026.

2026 implication:

  • If rates drift down even modestly (say mid-6s to low-6s), payment-qualified buyers return.
  • If rates stall or rise, attached product usually feels it first because the buyer pool is more rate-sensitive.

2) Inventory: the entire forecast hinges on “how many sellers decide to move”

San Diego remains constrained by a long-running supply issue: owners with low locked-in rates, limited move-up options, and high replacement costs. The MLS report shows inventory was extremely low at year end (December 2025) in both detached and attached.

2026 implication:

  • A meaningful price decline is hard to sustain without a supply surge or a job shock.
  • A modest rate decline can increase demand faster than supply, pushing pricing back into mild appreciation.

3) Sales volume: the “comeback” story is more believable than the “crash” story

Nationally, NAR’s chief economist has projected a notable sales rebound in 2026 (double-digit growth in transactions) and continued price gains nationally. San Diego won’t mirror the nation perfectly—but if transaction volume rises, it usually improves price support in submarkets with chronically low supply (many parts of coastal and central San Diego).

4) Affordability: detached and attached will diverge

  • Detached is the “equity-driven” market in San Diego: move-up buyers, high-income professionals, multi-generational wealth, and cash/equity positions.
  • Attached is the “monthly payment” market: first-time buyers, downsizers, and affordability-focused households.

When affordability improves even slightly (rate dip, income growth, price stabilization), attached demand typically responds faster—but attached also faces HOA sensitivity and investor math (rent vs payment spreads).

5) New construction and resale competition

San Diego’s resale market dominates, but new builds still matter at the margins because builders can buy down rates and offer incentives. When resale supply is thin, builders become the “pressure valve” for demand—especially for attached products and newer master-planned pockets.

2026 price outlook: the base case and realistic ranges

Base case for 2026 (most likely)

  • Detached: flat-to-moderate appreciation (think low single digits)
  • Attached: modest appreciation, with more volatility neighborhood-to-neighborhood

Why? Because the market is starting from tight supply (~1–1.5 months) and prices that already proved they can hold even as days-on-market increased.

A practical “range” (not a promise)

  • Detached: roughly 0% to +5%
  • Attached: roughly -2% to +6%

Attached has a wider range because it is more sensitive to:

  • mortgage rate direction,
  • HOA dues and insurance costs,
  • and buyer substitution (renting longer vs buying).

How this aligns with broader California expectations

C.A.R.’s statewide 2026 forecast calls for mild price growth and a slight improvement in sales.
San Diego often behaves as a “premium coastal” market inside that statewide trend—meaning it can outperform on price stability when supply remains constrained.

Detached vs. Attached: what I expect to be different in 2026

Single-family detached (SFD): “tight, picky, but supported”

What drives detached in 2026

  • Move-up sellers are still constrained (replacement cost shock).
  • Many buyers are equity-rich from prior homes.
  • School-adjacent, coastal-adjacent, and commute-friendly pockets remain supply-starved.

What to watch

  • If rates fall even a little, well-priced detached homes will still get multiple-offer activity—especially under key psychological price points.

Single-family attached (townhomes/condos): “rate-sensitive, value-driven”

What drives attached in 2026

  • If rates stabilize or dip, first-time buyers re-enter.
  • Downsizers who want lower maintenance are active, but they compare HOA + insurance + taxes carefully.
  • Investors are selective: the rent-to-payment gap matters.

What to watch

  • Buildings/communities with rising HOA, deferred maintenance, or insurance issues can underperform even if the broader market improves.
  • New construction incentives can pull demand away from resale attached inventory.

The most likely 2026 market “shape” in San Diego

Here’s the pattern I expect most consumers to feel:

  1. Early 2026: more normal seasonality (buyers test the waters, sellers cautious)
  2. Spring 2026: best chance for competition to return if rates cooperate
  3. Late 2026: market becomes more segmented—some neighborhoods feel hot, others feel flat

This is consistent with a market that is no longer “pandemic chaotic,” but still not “fully balanced.”

Risks that could change the forecast

No forecast is complete without the “what would break it” list:

  • Rates re-accelerate upward (inflation surprise, bond yields rise): attached softens first, then detached.
  • Labor market shock (significant job losses): forced selling rises, inventory loosens.
  • Policy or lending changes that materially alter buyer qualification.
  • Insurance/HOA cost spikes (especially for attached): affordability gets worse even if rates drop.

What this means for buyers and sellers in 2026

If you’re buying in 2026

  • Buy the payment, not the headline. If rates dip, competition returns quickly in San Diego.
  • Attached buyers: scrutinize HOA budgets/reserves and insurance realities—those costs are “forever,” not just year one.
  • Detached buyers: focus on micro-location, lot utility, and functional floorplans (those hold value best in flatter markets).

If you’re selling in 2026

  • Pricing strategy matters more than 2021–2022. “DOM” Days on Market is higher than the frenzied years, so the market punishes “hope pricing.”
  • The homes that win are the ones that feel turn-key, clean, and correctly priced—especially in the attached segment where buyers comparison-shop harder.

Bottom line prediction for 2026 (San Diego single-family)

San Diego enters 2026 with tight supply and prices that have been resilient, even as marketing times rose.
My expectation is a mildly improving market, led more by increased transactions (as rates cooperate) than by runaway price growth.

Interested in buying or selling your home or condo in San Diego?

Contact The Lewis Team, we would love to help! 619-981-3917

San Diego Real Estate

Oct. 30, 2025

Spacious Wildomar Home with Pool, Spa & RV Parking

Spacious Wildomar Home with Pool, Spa & RV Parking

5 Bedroom Home in Riverside California

Just Listed Home in Wildomar Riverside CA

Discover this beautifully maintained 5-bedroom, 3-bath executive home offering 3,124 sq. ft. of living space on a large corner lot in the heart of Wildomar. Thoughtfully designed for comfort and versatility, the floor plan features a full bedroom and bathroom on the main level—ideal for guests or multi-generational living.

A welcoming covered front porch leads into a bright, open interior with soaring vaulted ceilings and designer tile flooring. The kitchen is the centerpiece of the home, showcasing granite counters, a center island, tall eat-at bar, stainless steel appliances, and a breakfast nook with built-in desk. The family room’s cozy fireplace creates a perfect gathering space, while the oversized upstairs landing offers flexibility for a loft, office, or study area. The expansive primary suite includes high ceilings, abundant natural light, and an ensuite bath with dual sinks, soaking tub, and walk-in closet.

Step into your private backyard oasis complete with a sparkling pool, rock-surround spa, built-in BBQ, and lush tropical landscaping—ideal for entertaining or relaxing. Enjoy practical perks like PAID SOLAR, a 3-car garage, and gated RV parking for your recreational vehicles and toys. Conveniently located near shopping, dining, parks, and freeway access.

32789 Starlight St Wildomar CA 92595

  • 5 Bedrooms
  • 3 Baths
  • 3,124 Sq Ft
  • 3 Car Garage
  • Pool & Spa
  • Price $733,000

Contact us today for a private showing of this exceptional Wildomar property.

The Lewis Team

619-656-0655

san diego real estate

Oct. 20, 2025

Is the San Diego Housing Market Going To Crash

Is the San Diego Housing Market Going To Crash

Real Estate Experts Weigh In

Is the San Diego Housing Market Going To Crash 2025 2026

If you’ve seen headlines or social posts calling for a housing crash, it’s easy to wonder if home values are about to take a hit. But here’s the simple truth.

The data doesn’t point to a crash. It points to slow, continued growth. San Diego is no different from the national trends.

And sure, it’s going to vary by local area. Some markets will see prices rise more than others. And some may even see small, short-term declines. But the big picture is: home prices are expected to rise nationally, not fall, over the next 5 years.

The Real Story Is in the Expert Forecasts

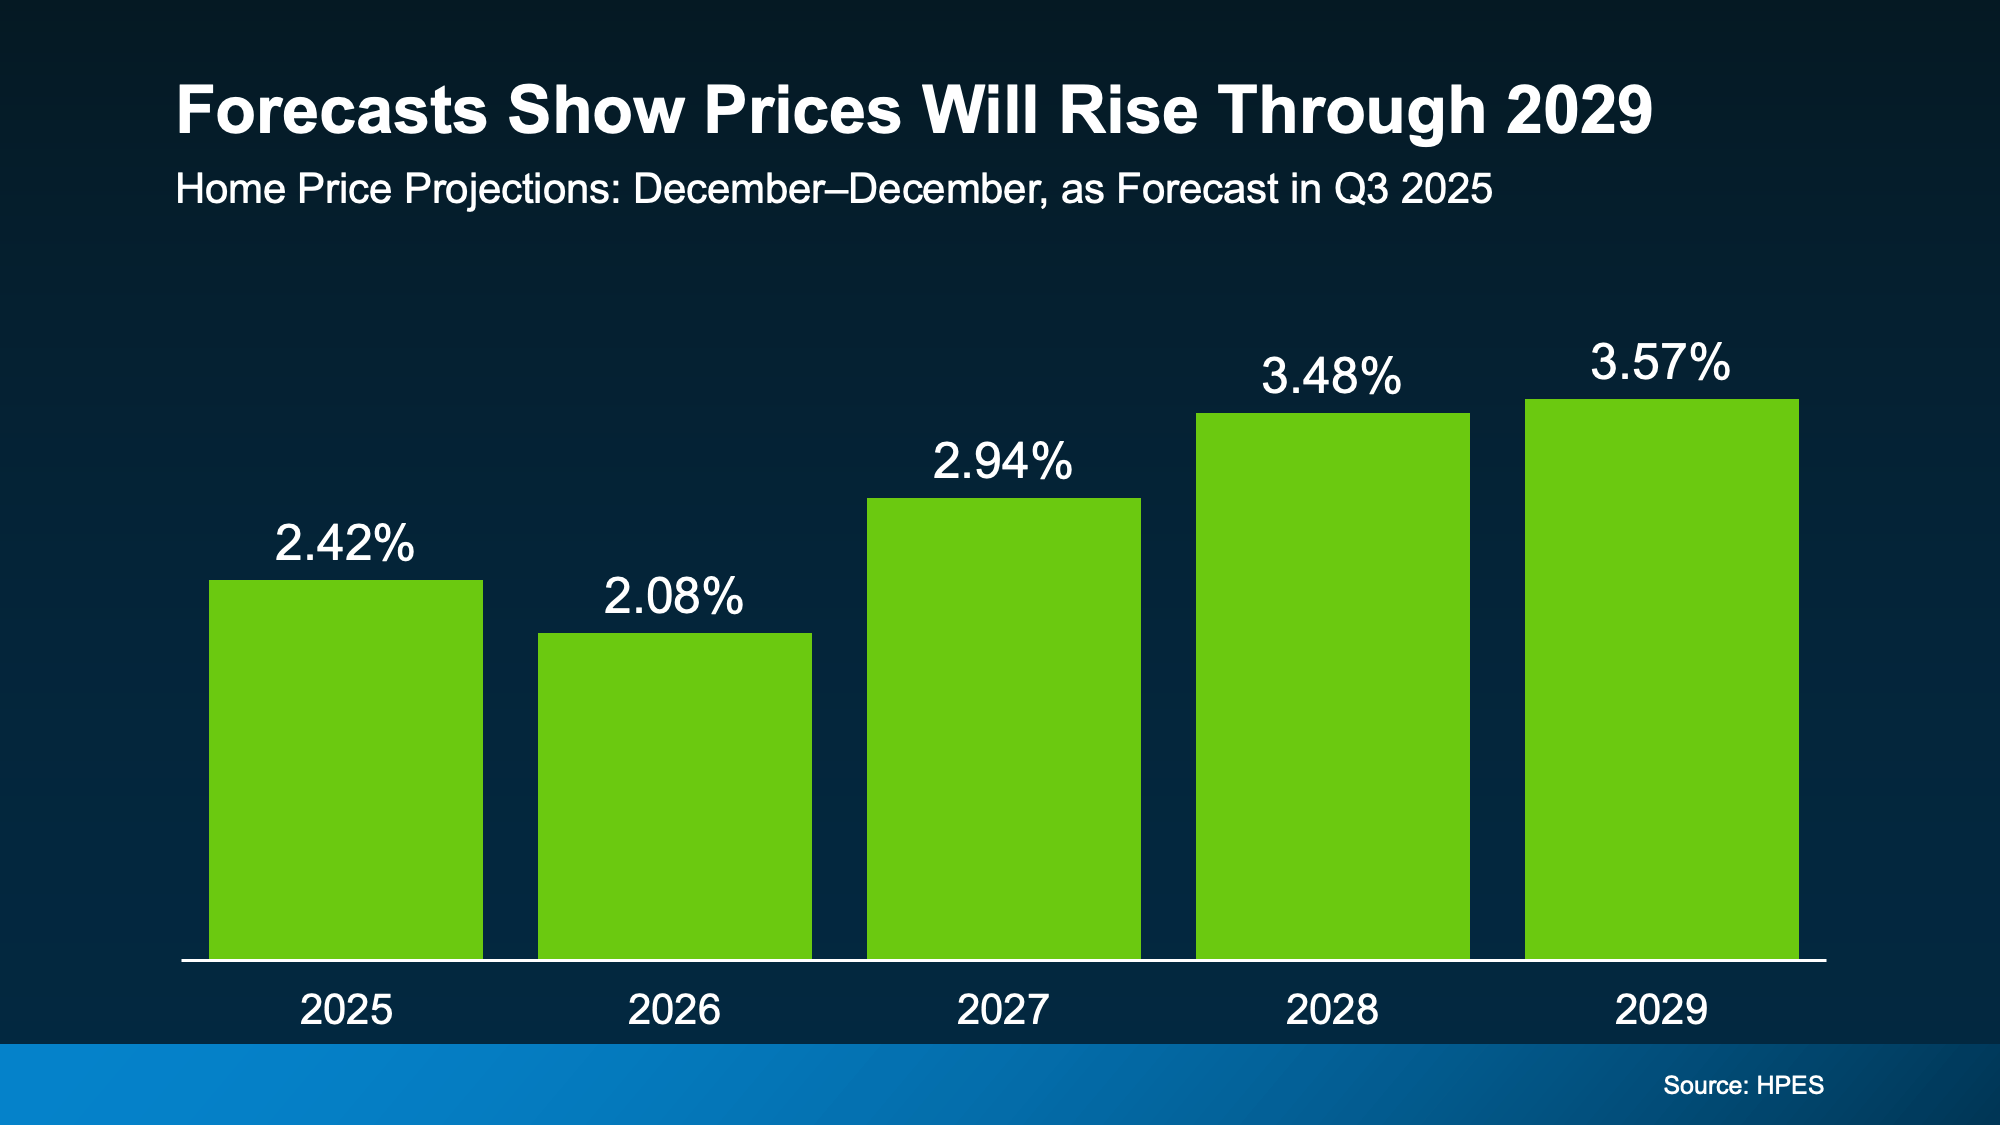
In the Home Price Expectations Survey (HPES) from Fannie Mae, each quarter over 100 leading housing market experts weigh in on where they project home prices will go from here. And in the report that was just released, the experts agree prices are projected to climb nationally through at least 2029 (see graph below):

Forecast Is San Diego Real Estate Going To Crash in 2025 2026

Here’s how to read this visual. Each bar in that graph shows an increase, not a loss. It’s just that the anticipated pace of that appreciation varies year-to-year.

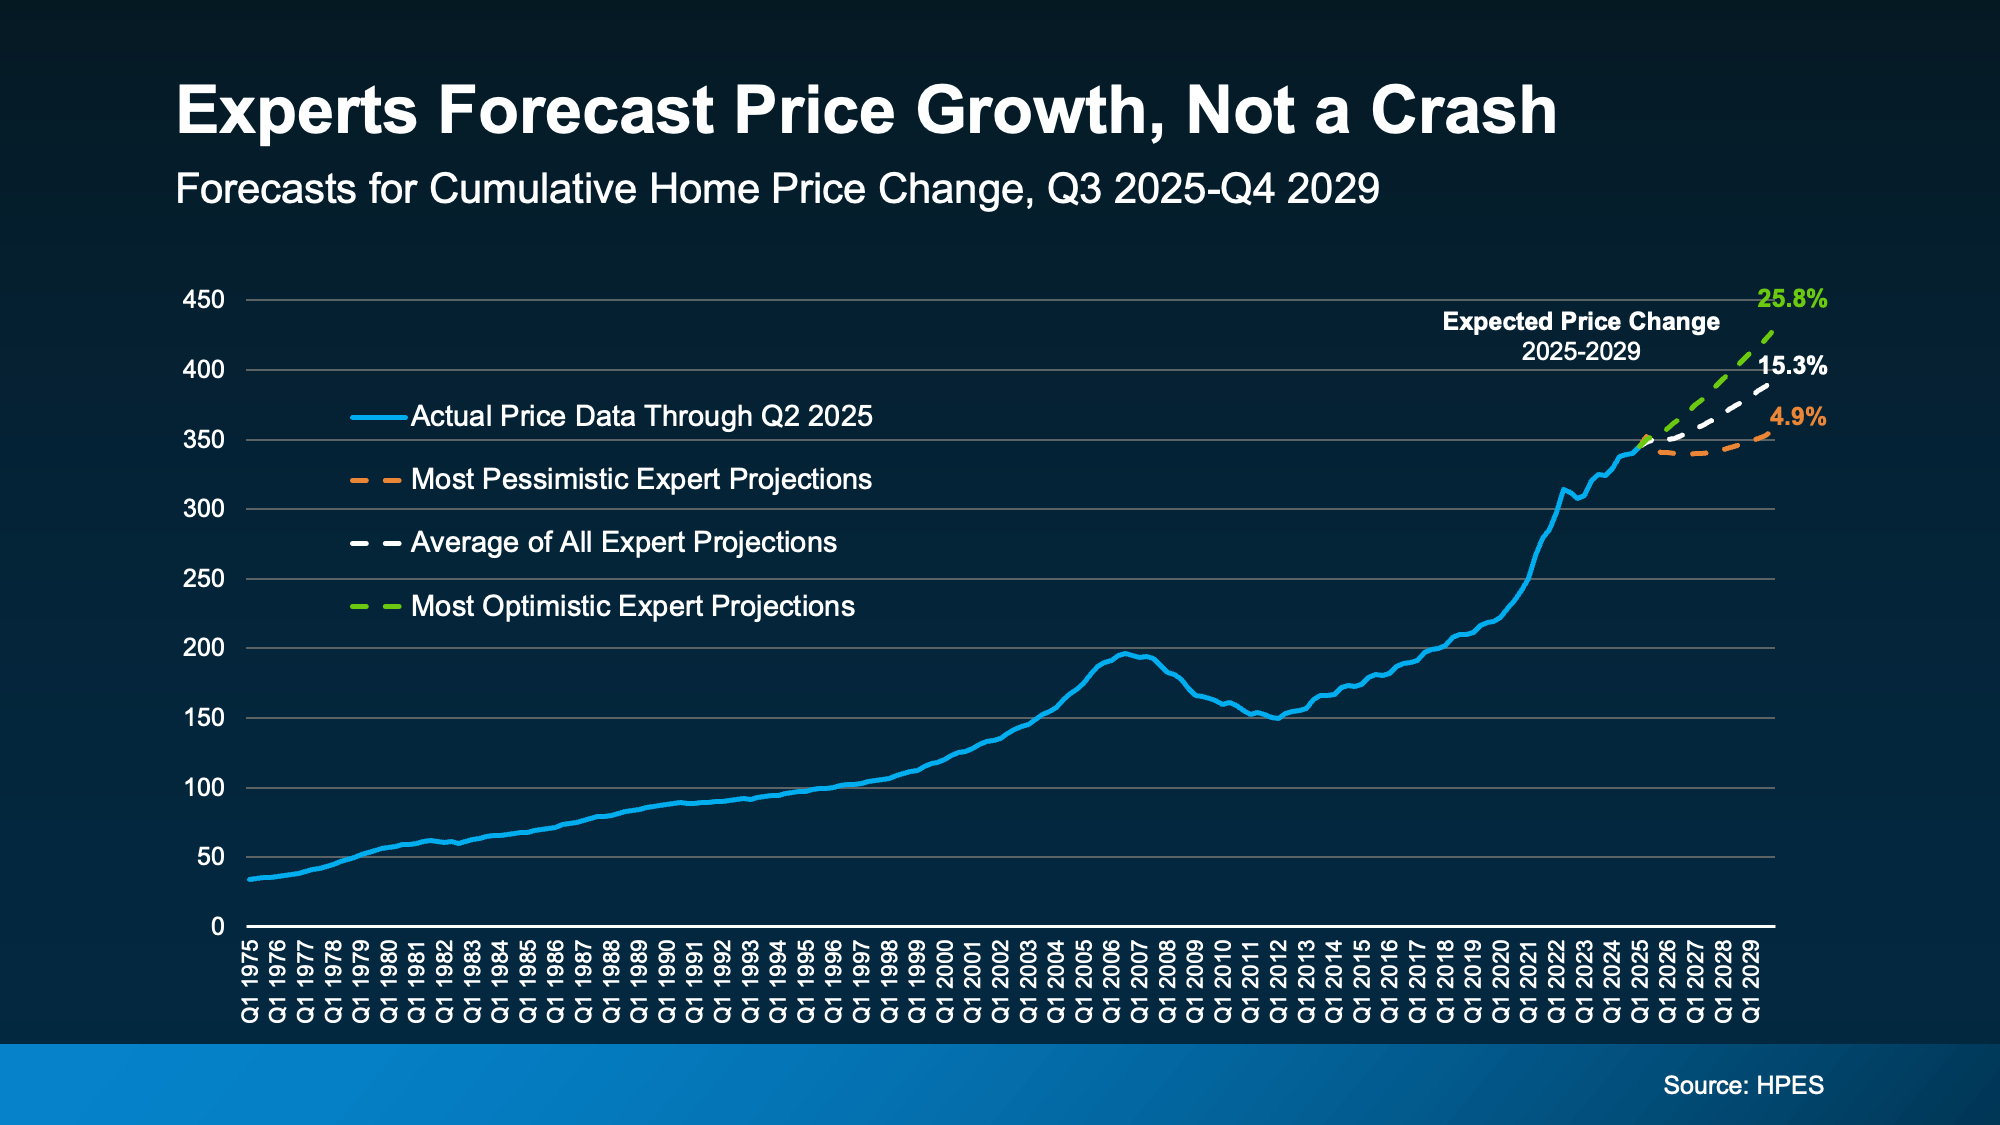
And to further drive this home, let’s look at another view of where prices are and where they’re expected to go. In this version, the expert forecasts are broken into 3 categories: the overall average, the most optimistic projections, and the most pessimistic projections (see chart below):

Notice how even the most pessimistic forecasters say we’ll see prices rise by almost 5% over the next few years.

Overall, prices are expected to rise about 15% from now through the end of 2029.

The optimists say we’ll beat that and see a roughly 26% increase.

And even the pessimists anticipate prices will go up by 5% during that period.

What sticks out the most? None of these groups who study the market are forecasting a crash, or even a decline, over the next 5 years.

How This Compares to “Normal” for the Market

Opinion by experts Is the San Diego Housing Market Crashing

Now, focus back on the first graph. The projections call for 2-3.5% price increases in each of the next five years. For context, the average rate of appreciation for the last 25 years was closer to 4-5% annually.

So, while that’s slightly below the historical average, it’s much more sustainable and typical than where the market was in 2020, 2021, and 2022.

Back then, prices rose too much, too fast based on record-low supply and record-high demand. Some places even saw prices climb by 15-20%.

So, while it may feel like prices are stalling compared to those pandemic-era surges, what’s really happening is that the market is finally finding balance again.

Why Prices Aren’t Expected To Crash in San Diego

A lot of the chatter about home prices today is based on that rapid rise and the old saying that what goes up, must come down. But historically, that’s not really true. Home prices almost always rise.

And the main reason we’re not heading for a repeat of 2008 is simple: supply and demand.

Even though affordability challenges have made it harder for some people to buy over the past few years, there still aren’t enough homes for everyone who wants one. And that ongoing shortage is keeping upward pressure on prices nationally. 

That’s why experts across the board can confidently agree: we’re not headed for a price collapse, but for steady, long-term appreciation.

And just in case it’s the economy that’s got you worried, remember this. Over the past 50 years, there have been plenty of economic events that have impacted the market. And one thing that’s consistently been true throughout time is the housing market always recovers. And we’re coming through that turn right now and going into a recovery.

Bottom Line

If you’ve been waiting to buy or sell because you’re worried about a crash, it’s time to look at the data – not the headlines.

The question isn’t if home prices will rise, it’s by how much.

Let’s connect so you know what’s happening in our local market and what these forecasts mean for your next move.

The Lewis Team - 619-656-0655

San Diego's Real Estate Team

san diego real estate

The information contained, and the opinions expressed, in this article are not intended to be construed as investment advice. Keeping Current Matters, Inc. does not guarantee or warrant the accuracy or completeness of the information or opinions contained herein. Nothing herein should be construed as investment advice. You should always conduct your own research and due diligence and obtain professional advice before making any investment decision. Keeping Current Matters, Inc. will not be liable for any loss or damage caused by your reliance on the information or opinions contained herein.

Oct. 16, 2025

Why Experts Say Mortgage Rates Should Ease Over the Next Year

Why Experts Say Mortgage Rates Should Ease Over the Next Year

But is it going to last?

Why Experts Say Mortgage Rates Should Ease Over the Next Year

You want mortgage rates to fall – and they've started to. But is it going to last? And how low will they go?

The San Diego Real Estate Market moves when rates go up and down.

Experts say there’s room for rates to come down even more over the next year. And one of the leading indicators to watch is the 10-year treasury yield. Here's why.

The Link Between Mortgage Rates and the 10-Year Treasury Yield

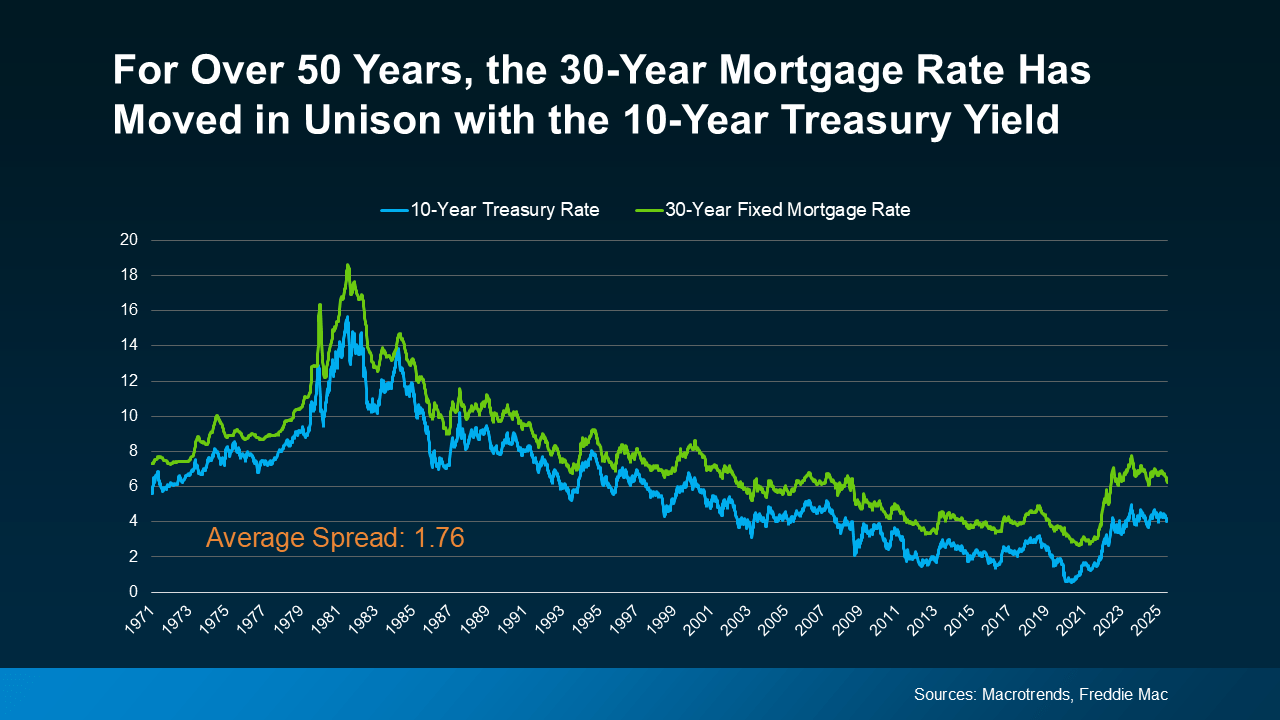
For over 50 years, the 30-year fixed mortgage rate has closely followed the movement of the 10-year treasury yield, which is a widely watched benchmark for long-term interest rates (see graph below):

The Link Between Mortgage Rates and the 10-Year Treasury Yield

When the treasury yield climbs, mortgage rates tend to follow. And when the yield falls, mortgage rates typically come down.

It’s been a predictable pattern for over 50 years. So predictable, that there’s a number experts consider normal for the gap between the two. It’s known as the spread, and it usually averages about 1.76 percentage points, or what you sometimes hear as 176 basis points.

The Spread Is Shrinking

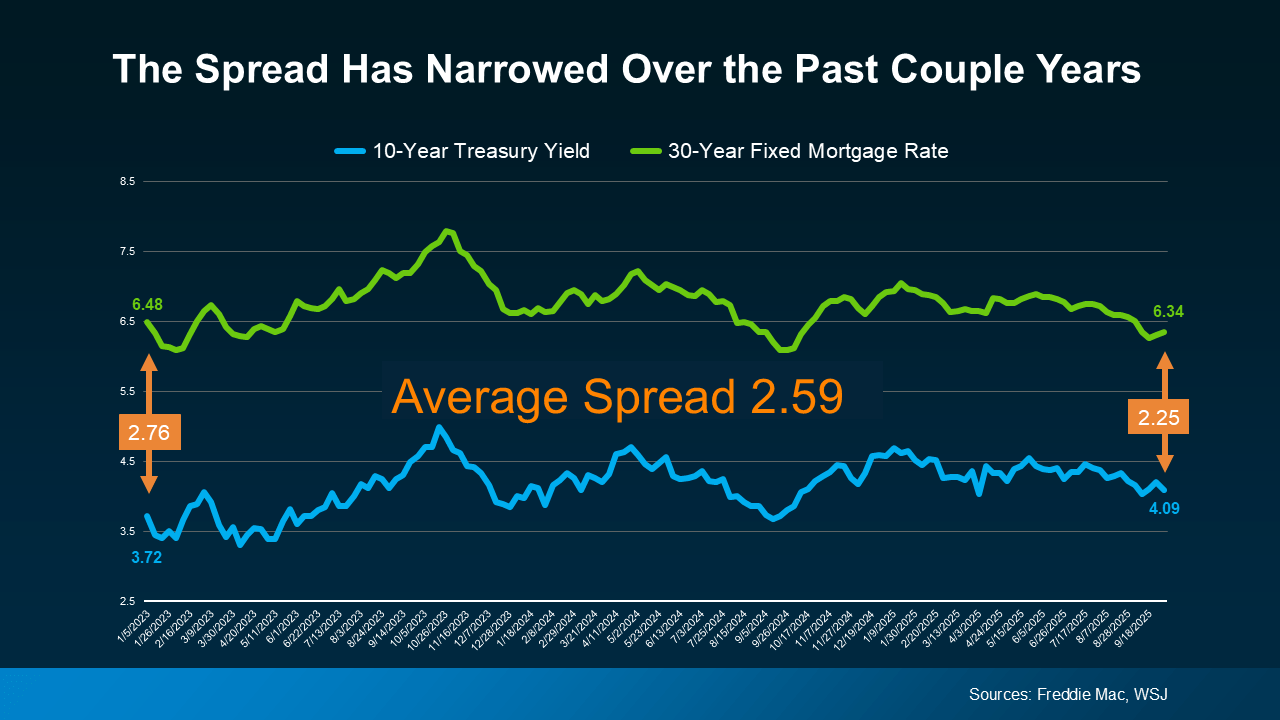
Over the past couple of years, though, that spread has been much wider than normal. Why? Think of the spread as a measure of fear in the market. When there’s lingering uncertainty in the economy, the gap widens beyond its usual norm. That’s one of the reasons why mortgage rates have been unusually high over the past few years.

But here’s a sign for optimism. Even though there’s still some lingering uncertainty related to the economy, that spread is starting to shrink as the path forward is becoming clearer (see graph below):

one of the reasons why mortgage rates have been unusually high over the past few years

And that opens the door for mortgage rates to come down even more. As a recent article from Redfin explains:

“A lower mortgage spread equals lower mortgage rates. If the spread continues to decline, mortgage rates could fall more than they already have.”

The 10-Year Treasury Yield Is Expected To Decline

It’s not just the spread, though. The 10-year treasury yield itself is also forecast to come down in the months ahead. So, when you combine a lower yield with a narrowing spread, you have two key forces potentially pushing mortgage rates down going into next year.

This long-term relationship is a big reason why you see experts currently projecting mortgage rates will ease, with a fringe possibility they’ll hit the upper 5s toward the end of next year.

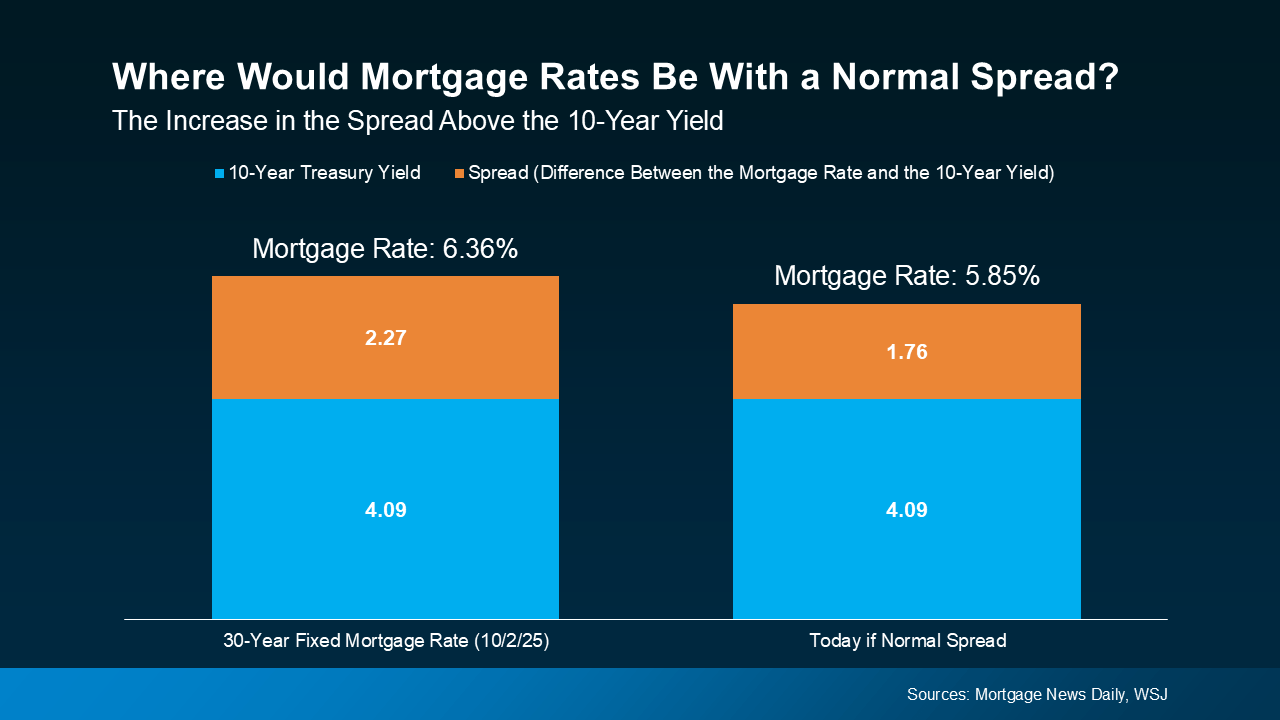
Here's how it works. Take the 10-year treasury yield, which is sitting at about 4.09% at the time this article is being written, and then add the average spread of 1.76%. From there, you’d expect mortgage rates to be around 5.85% (see graph below):

The 10-Year Treasury Yield Is Expected To Decline

But remember, all of that can change as the economy shifts. And know for certain that there will be ups and downs along the way. 

How these dynamics play out will depend on where the economy, the job market, inflation, and more go from here. But the 2026 outlook is currently expected to be a gradual mortgage rate decline. And as of now, things are starting to move in the right direction.

Bottom Line

Keeping up with all of these shifts can feel overwhelming. That’s why having an experienced agent or lender on your side matters. They’ll do the heavy lifting for you.

If you want real-time updates on mortgage rates, let's connect so you have someone to keep you in the loop and help you plan your next move.

The information contained, and the opinions expressed, in this article are not intended to be construed as investment advice. Keeping Current Matters, Inc. does not guarantee or warrant the accuracy or completeness of the information or opinions contained herein. Nothing herein should be construed as investment advice. You should always conduct your own research and due diligence and obtain professional advice before making any investment decision. Keeping Current Matters, Inc. will not be liable for any loss or damage caused by your reliance on the information or opinions contained herein.

We believe every family should feel confident when buying and selling a home.

The Lewis Team - San Diego's Real Estate Team

San Diego Real Estate

Oct. 13, 2025

San Diego County Real Estate Market Update October 2025

San Diego County Real Estate Market Update October 2025

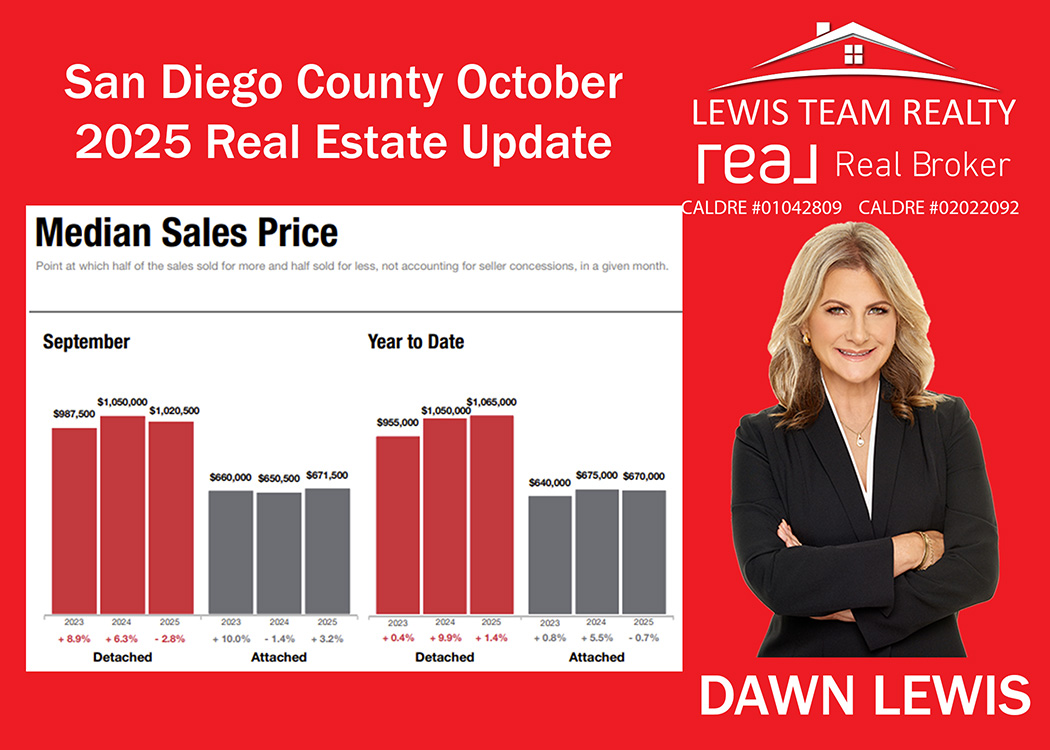
San Diego Median Detached Home Price Dropped 2.8% from September 2024 to 2025

Current as of October 5, 2025. Data source: San Diego MLS via Greater San Diego Association of REALTORS®.

San Diego County 2025 October Real Estate Update

Quick take

  • Market activity ticked up: Countywide closed sales rose 6.2% YoY (1,963 closings), and pending sales rose 6.0% YoY (2,002).

  • Inventory expanded materially: Homes for sale up 29.0% YoY (5,647). Months’ supply increased to 2.9 (+26.1% YoY).

  • Prices held overall: County median price edged +1.1% YoY to $900,000; average price +2.8% YoY to $1,206,886.

  • Negotiability widened and pace cooled: % of original list price slipped to 97.0% (-1.0 pt YoY), and DOM increased to 42 days (+23.5% YoY).


Detached vs. Attached: two different stories

Detached homes in San Diego County (single-family)

  • Sales & listings: Closed sales +5.1% (1,267); new listings +3.4% (1,700); pending +7.4% (1,302).

  • Pricing: Median softened -2.8% YoY to $1,020,500; average +2.3% to $1,416,269.

  • Inventory & speed: Active inventory +19.2% (3,259) with 2.6 months’ supply (+13.0%); DOM up to 41 days (+20.6%).

  • Pricing power: Sellers received 97.0% of original list price (-0.9 pt YoY).

Read: Detached supply has loosened modestly, giving buyers more choice and bargaining room, particularly around inspection credits and price reductions on longer-sitting listings.

San Diego County Real Estate Market 2025 October

Attached homes in San Diego County (condos/townhomes)

  • Sales & listings: Closed sales +8.1% (696); new listings +11.9% (1,026); pending +3.4% (700).

  • Pricing: Median +3.2% to $671,500; average +5.6% to $823,220.

  • Inventory & speed: Active inventory +45.2% (2,388) with 3.5 months’ supply (+45.8%); DOM up to 43 days (+19.4%).

  • Pricing power: 97.1% of original list price (-1.0 pt YoY).

Read: Despite much higher condo inventory, entry-point demand is keeping prices firm. Buyers can be selective, but well-priced, updated units still move.


Countywide detail (all properties)

  • New listings: 2,726 in September (+6.4% YoY).

  • Closed sales: 1,963 (+6.2% YoY).

  • Dollar volume: $2.345B (+8.1% YoY).

  • Percent of original list price received: 97.0% (down from 98.0% last year).

  • Days on market: 42 (was 34 a year ago).

  • Affordability Index: 47 (down slightly YoY), reflecting persistent rate/price pressure even with more choices.


Why this is happening (context)

More homes hit the market through 2025, especially since spring. That rise in supply has lengthened marketing times and nudged negotiation back toward buyers. Even so, San Diego’s demand base remains resilient—especially for move-in-ready homes in popular neighborhoods—keeping countywide prices essentially flat to slightly higher versus last year.


What this means for you

For sellers looking to sell a home in San Diego

  • Price precisely from day one. With DOM rising into the low-40s and buyers paying ~97% of original list on average, overpricing leads to longer market time and bigger concessions later.

  • Presentation still pays. Homes that are turnkey are outperforming; invest in pre-listing prep, pro photos/video, and a strong launch week.

  • Strategy by segment:

    • Detached: Expect more competition; plan for targeted price improvements if no serious activity by Day 14–21.

    • Attached: Demand is steady but inventory is up sharply—lean into value (HOA clarity, upgrades, rate-buydown options).

For buyers looking to buy a home in San Diego

  • You have options. Inventory up 29% YoY countywide and months’ supply near 3.0 gives you leverage, particularly on homes >30 days on market.

  • Negotiate smartly. Aim for seller credits toward rate buydowns or closing costs; typical outcomes are ~3% off original list, more if condition or pricing is off.

  • Be ready to act. Well-priced, updated listings still draw competition—have underwriting and terms tight so you can move quickly when the right home appears.


Year-to-date pulse (through September)

  • Detached: YTD median +1.4% ($1,065,000); closed sales -0.9%; pending roughly flat.

  • Attached: YTD median -0.7% ($670,000); closed sales -4.7%; pending -3.1%.

  • Total market: YTD median $905,000 (+0.6%), closed 17,687 (-2.3%), $ volume $20.565B (-2.0%).

Bottom line: 2025 has been a “more inventory, moderate demand” year. Prices are generally stable, with micro-moves by segment and condition.


How we help

If you’re considering a move, we’ll give you a hyper-local pricing read, show you where your home sits versus active and pending competition, and map the likely days-to-offer based on today’s absorption in your micro-neighborhood. Want a data-driven plan for buying or selling this fall? Let’s talk.

Find out your San Diego Home Value!

Report: Market Activity for the Greater San Diego Association of REALTORS®, September 2025 Monthly Snapshot. Current as of October 5, 2025.

San Diego Real Estate