San Diego County Real Estate Market Update October 2025
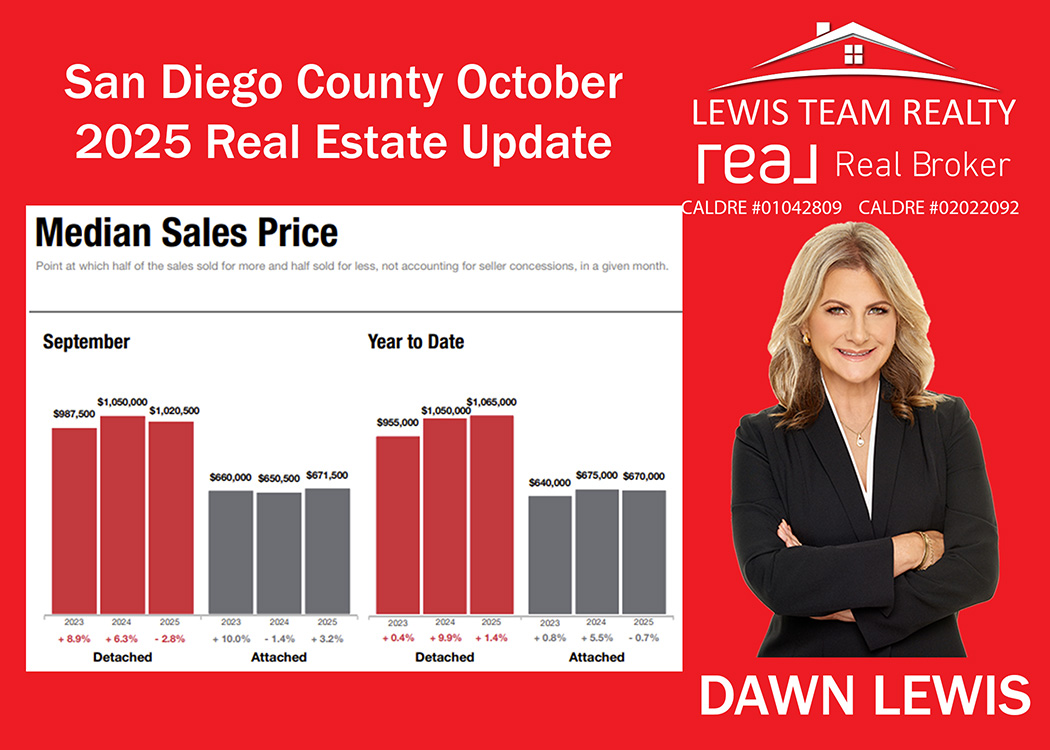
San Diego Median Detached Home Price Dropped 2.8% from September 2024 to 2025
Current as of October 5, 2025. Data source: San Diego MLS via Greater San Diego Association of REALTORS®.
Quick take
-
Market activity ticked up: Countywide closed sales rose 6.2% YoY (1,963 closings), and pending sales rose 6.0% YoY (2,002).
-
Inventory expanded materially: Homes for sale up 29.0% YoY (5,647). Months’ supply increased to 2.9 (+26.1% YoY).
-
Prices held overall: County median price edged +1.1% YoY to $900,000; average price +2.8% YoY to $1,206,886.
-
Negotiability widened and pace cooled: % of original list price slipped to 97.0% (-1.0 pt YoY), and DOM increased to 42 days (+23.5% YoY).
Detached vs. Attached: two different stories
Detached homes in San Diego County (single-family)
-
Sales & listings: Closed sales +5.1% (1,267); new listings +3.4% (1,700); pending +7.4% (1,302).
-
Pricing: Median softened -2.8% YoY to $1,020,500; average +2.3% to $1,416,269.
-
Inventory & speed: Active inventory +19.2% (3,259) with 2.6 months’ supply (+13.0%); DOM up to 41 days (+20.6%).
-
Pricing power: Sellers received 97.0% of original list price (-0.9 pt YoY).
Read: Detached supply has loosened modestly, giving buyers more choice and bargaining room, particularly around inspection credits and price reductions on longer-sitting listings.

Attached homes in San Diego County (condos/townhomes)
-
Sales & listings: Closed sales +8.1% (696); new listings +11.9% (1,026); pending +3.4% (700).
-
Pricing: Median +3.2% to $671,500; average +5.6% to $823,220.
-
Inventory & speed: Active inventory +45.2% (2,388) with 3.5 months’ supply (+45.8%); DOM up to 43 days (+19.4%).
-
Pricing power: 97.1% of original list price (-1.0 pt YoY).
Read: Despite much higher condo inventory, entry-point demand is keeping prices firm. Buyers can be selective, but well-priced, updated units still move.
Countywide detail (all properties)
-
New listings: 2,726 in September (+6.4% YoY).
-
Closed sales: 1,963 (+6.2% YoY).
-
Dollar volume: $2.345B (+8.1% YoY).
-
Percent of original list price received: 97.0% (down from 98.0% last year).
-
Days on market: 42 (was 34 a year ago).
-
Affordability Index: 47 (down slightly YoY), reflecting persistent rate/price pressure even with more choices.
Why this is happening (context)
More homes hit the market through 2025, especially since spring. That rise in supply has lengthened marketing times and nudged negotiation back toward buyers. Even so, San Diego’s demand base remains resilient—especially for move-in-ready homes in popular neighborhoods—keeping countywide prices essentially flat to slightly higher versus last year.
What this means for you
For sellers looking to sell a home in San Diego
-
Price precisely from day one. With DOM rising into the low-40s and buyers paying ~97% of original list on average, overpricing leads to longer market time and bigger concessions later.
-
Presentation still pays. Homes that are turnkey are outperforming; invest in pre-listing prep, pro photos/video, and a strong launch week.
-
Strategy by segment:
-
Detached: Expect more competition; plan for targeted price improvements if no serious activity by Day 14–21.
-
Attached: Demand is steady but inventory is up sharply—lean into value (HOA clarity, upgrades, rate-buydown options).
-
For buyers looking to buy a home in San Diego
-
You have options. Inventory up 29% YoY countywide and months’ supply near 3.0 gives you leverage, particularly on homes >30 days on market.
-
Negotiate smartly. Aim for seller credits toward rate buydowns or closing costs; typical outcomes are ~3% off original list, more if condition or pricing is off.
-
Be ready to act. Well-priced, updated listings still draw competition—have underwriting and terms tight so you can move quickly when the right home appears.
Year-to-date pulse (through September)
-
Detached: YTD median +1.4% ($1,065,000); closed sales -0.9%; pending roughly flat.
-
Attached: YTD median -0.7% ($670,000); closed sales -4.7%; pending -3.1%.
-
Total market: YTD median $905,000 (+0.6%), closed 17,687 (-2.3%), $ volume $20.565B (-2.0%).
Bottom line: 2025 has been a “more inventory, moderate demand” year. Prices are generally stable, with micro-moves by segment and condition.
How we help
If you’re considering a move, we’ll give you a hyper-local pricing read, show you where your home sits versus active and pending competition, and map the likely days-to-offer based on today’s absorption in your micro-neighborhood. Want a data-driven plan for buying or selling this fall? Let’s talk.
Find out your San Diego Home Value!
Report: Market Activity for the Greater San Diego Association of REALTORS®, September 2025 Monthly Snapshot. Current as of October 5, 2025.