Pacific Beach and Mission Beach Real Estate
June 2026 Market Report for ZIP Code 92109
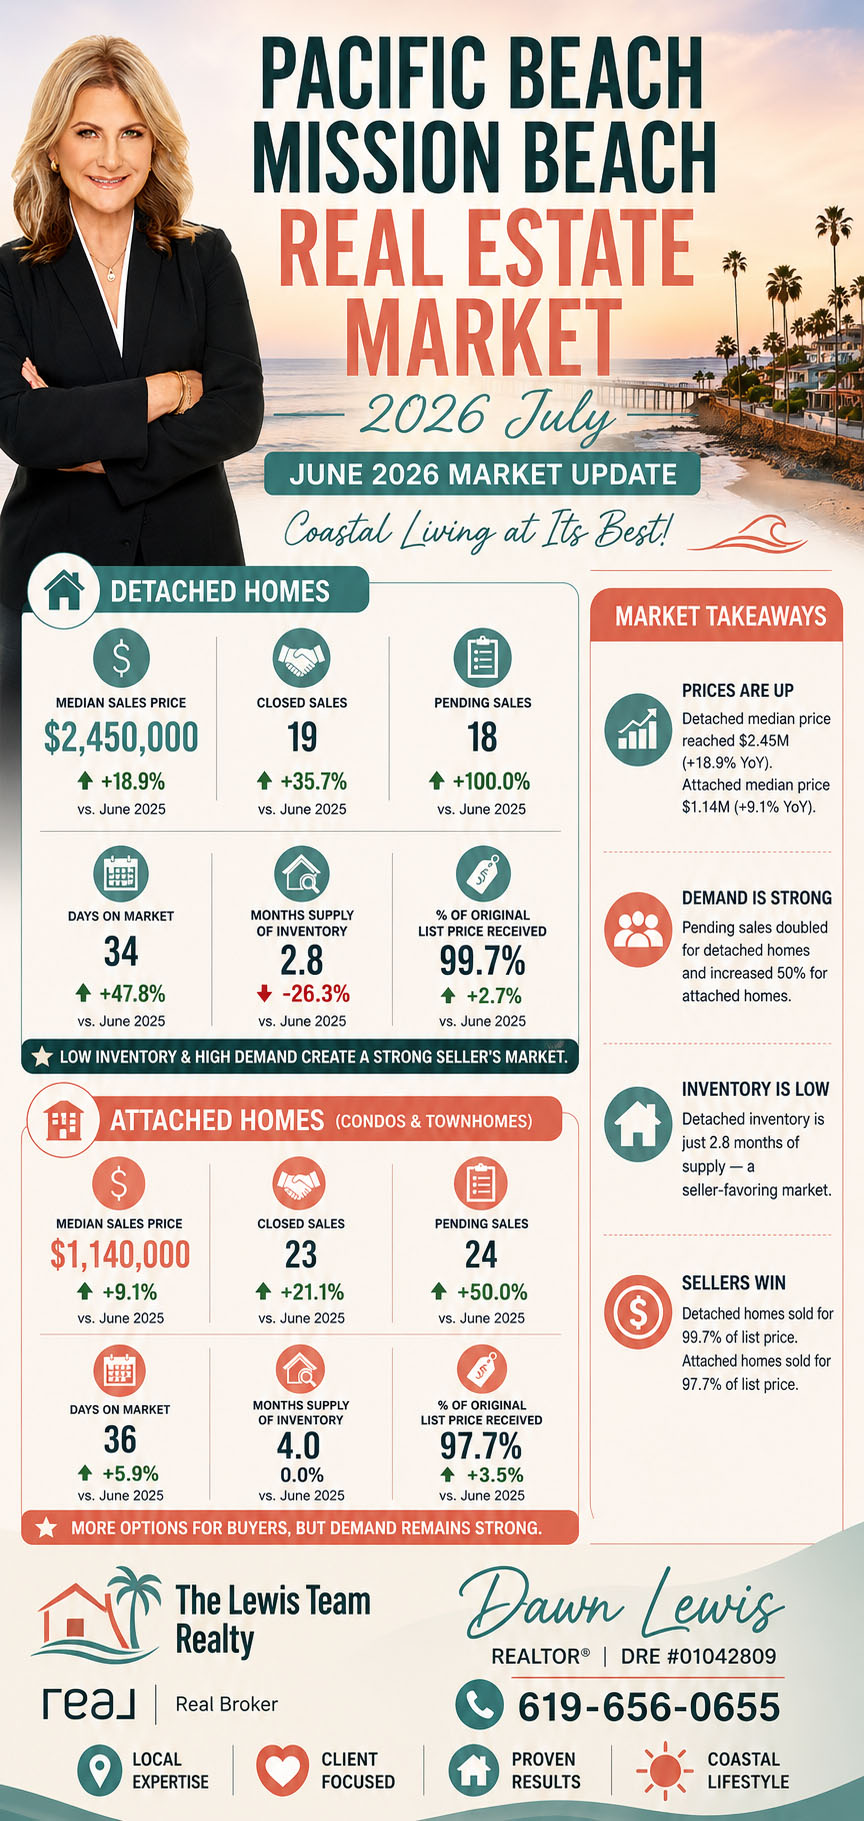
The Pacific Beach and Mission Beach real estate market produced a strong and active finish to the first half of 2026. June’s housing data shows higher sales activity, rising median prices, and stronger seller results across both detached homes and attached properties when compared with June 2025.
The market, however, is not moving uniformly. Detached single-family homes are operating under significantly tighter inventory conditions than condominiums and townhomes. Buyers of detached homes are facing fewer available properties, higher prices, and greater competition, while buyers in the attached-home market generally have more inventory and slightly more negotiating room.
This report examines June 2026 activity in Pacific Beach and Mission Beach, covering detached homes as well as condominiums and townhomes throughout ZIP code 92109. The statistics were current as of July 5, 2026, and were compiled from San Diego MLS data.
Pacific Beach and Mission Beach Market at a Glance
June was an especially strong month for detached-home sales.
Compared with June 2025:
- Detached pending sales doubled.
- Detached closed sales increased by more than 35%.
- The detached median sales price rose to $2.45 million.
- Detached inventory declined by more than 24%.
- Sellers of detached homes received an average of 99.7% of their original asking price.
The attached market also improved:
- Pending condominium and townhome sales increased by 50%.
- Closed attached sales increased by more than 21%.
- The median attached sales price rose to $1.14 million.
- Sellers received 97.7% of their original list price.
- Inventory remained comparatively balanced at four months of supply.
The overall picture is of a high-value coastal market with healthy buyer demand, but with noticeably different conditions depending on property type.
Detached Home Market
New Detached Listings Increased in June
There were 22 new detached-home listings placed on the market in June 2026, compared with 17 in June 2025. That represents an increase of 29.4%.
This monthly increase gave buyers more new options during June, but it does not mean that detached inventory is broadly expanding. The year-to-date numbers tell a different story.
Through the first six months of 2026, Pacific Beach and Mission Beach recorded 122 new detached listings, down from 139 during the same period in 2025. That is a year-over-year decline of 12.2%.
This distinction is important. June brought a temporary increase in new listings, but the total number of homeowners listing detached properties during the first half of the year remained below last year’s level.
For buyers, this means desirable detached homes may continue to attract immediate attention, particularly when they are properly priced, well maintained, or located close to the beach, bay, commercial districts, or other sought-after parts of 92109.
For sellers, reduced year-to-date listing activity provides a favorable competitive environment. A homeowner entering the market is competing against fewer detached listings than buyers encountered during the first half of 2025.
Pending Detached Sales Doubled
Detached pending sales increased from nine in June 2025 to 18 in June 2026, an increase of 100%.
This was one of the most significant changes in the June report.
Pending sales represent homes that entered into accepted contracts during the month. A doubling of pending activity suggests that buyers were highly engaged and willing to commit despite the elevated price point of the coastal market.
The increase was not limited to a single month. Through June:
- 81 detached homes entered escrow in 2026.
- 71 entered escrow during the same period in 2025.
- Year-to-date pending sales increased by 14.1%.
The year-to-date increase confirms that June’s strong activity was part of a broader improvement in buyer demand rather than simply an isolated monthly fluctuation.
Pending sales can also provide an indication of future closings. While not every escrow reaches completion, the elevated number of June pending sales could support continued closing activity during July and August.
Detached Closed Sales Rose 35.7%
Nineteen detached homes closed escrow in June 2026, compared with 14 sales in June 2025. Closed sales increased by 35.7%.
This is an important sign of market liquidity. Pacific Beach and Mission Beach detached homes frequently occupy a higher price tier than many surrounding San Diego neighborhoods, so a substantial increase in completed transactions indicates that qualified buyers remain willing and able to purchase at current price levels.
Year-to-date detached sales were more stable:
- 75 closed sales through June 2026.
- 74 closed sales through June 2025.
- An increase of 1.4%.
The modest year-to-date increase shows that overall first-half sales volume was nearly unchanged from last year. However, June itself was considerably more active.
This may indicate that some demand shifted later into the spring and early summer selling season. It could also reflect more transactions successfully reaching closing after buyers and sellers adjusted to current pricing and financing conditions.
Detached Median Sales Price Reached $2.45 Million
The median sales price for detached homes in Pacific Beach and Mission Beach rose from $2,060,000 in June 2025 to $2,450,000 in June 2026.
That was an increase of:
- $390,000 in one year.
- 18.9% on a percentage basis.
The monthly median of $2.45 million represents a substantial year-over-year increase and reinforces the premium buyers continue to place on detached ownership in ZIP code 92109.
The year-to-date median also rose significantly:
- $2,075,000 through June 2025.
- $2,360,000 through June 2026.
- An increase of 13.7%.
The year-to-date figure is especially useful because it includes a larger number of sales than the single-month figure. It suggests that the appreciation shown in June was not solely the result of one or two unusually expensive sales.
At the same time, median price movements in Pacific Beach and Mission Beach must be interpreted carefully. The area contains a wide range of detached properties, including:
- Smaller beach cottages.
- Older homes purchased for renovation or redevelopment.
- Remodeled coastal residences.
- Bay-adjacent and ocean-oriented properties.
- Larger luxury homes.
- Properties with multiple units or redevelopment potential.
A change in the number or type of homes sold can influence the median. The source report also cautions that percentage changes may appear extreme when calculated from a relatively small number of transactions. Nevertheless, both the monthly and year-to-date statistics point toward meaningful upward price pressure.
Detached Sellers Received 99.7% of Original List Price
Detached homes that closed in June 2026 received an average of 99.7% of their original asking price. That was up from 97.1% in June 2025.
This indicates that June sellers generally negotiated very little below their initial list price.
As a simplified example, a property originally listed at $2.5 million and selling at 99.7% of its original price would close approximately $7,500 below asking, before accounting for differences between individual transactions.
The statistic does not mean every home sold near list price. Some properties may have sold above asking, while others may have required reductions or concessions. However, the overall average reflects a market in which properly positioned detached homes retained substantial pricing power.
The year-to-date number was less aggressive:
- 98.9% through June 2025.
- 96.8% through June 2026.
- A decline of 2.1%.
This difference between the June result and the year-to-date result is revealing. It suggests that detached sellers faced more pricing resistance earlier in 2026, but conditions strengthened considerably by June.
It may also indicate that sellers who initially priced too aggressively had to make adjustments before securing buyers. In contrast, homes entering the market with an accurate price and strong presentation were likely better positioned to attract offers without major reductions.
The original-list-price percentage does not account for seller concessions or down-payment assistance. A transaction could therefore close near the original list price while still including credits toward repairs, closing costs, or other buyer expenses.
Detached Homes Took Longer to Sell
Despite the strong pricing and sales numbers, detached homes did not sell faster.
The average time on market increased from:
- 23 days in June 2025.
- 34 days in June 2026.
That represents an increase of 47.8%.
Year to date, detached marketing time also rose:
- 33 days through June 2025.
- 42 days through June 2026.
- An increase of 27.3%.
This is one of the most important counterbalances in the report.
Prices increased, pending sales rose, and inventory declined, yet homes generally took longer to reach closing. That combination suggests buyers remain active but selective.
Pacific Beach and Mission Beach buyers are often evaluating more than bedroom count and square footage. They may also be comparing:
- Exact location within 92109.
- Distance to the ocean or Mission Bay.
- Street traffic and noise.
- Parking and garage availability.
- Lot size and redevelopment potential.
- Short-term rental considerations.
- Property condition.
- Views.
- Outdoor space.
- Insurance and maintenance expenses.
- The quality and legality of additions or accessory units.
A property can be located in a low-inventory market and still remain unsold when its price does not match its condition, location, or development potential.
The increased marketing time reinforces the importance of precise pricing. Sellers should not assume that limited inventory guarantees an immediate sale at any asking price.
Detached Inventory Fell Sharply
There were 34 detached homes available for sale at the end of June 2026, compared with 45 one year earlier.
Inventory declined by 24.4%.
The months’ supply of detached inventory fell from 3.8 months in June 2025 to 2.8 months in June 2026, a decline of 26.3%.
Months of supply estimates how long it would take to sell the current inventory at the existing sales pace if no additional homes were listed.
A 2.8-month supply generally reflects a market that favors sellers, although individual results still depend heavily on price range, property condition, and location.
This is the clearest indication that detached homes are the more competitive portion of the Pacific Beach and Mission Beach market.
Demand is not only increasing; buyers are competing for a smaller available pool of homes.
Attached Home Market
The attached category includes condominiums and townhomes. These properties often provide a comparatively accessible entry point into the Pacific Beach and Mission Beach market, although many remain firmly within San Diego’s luxury price range.
The attached market was active in June, but it carried more inventory and offered buyers somewhat greater flexibility than the detached market.
Attached New Listings Declined During June
There were 35 new attached listings in June 2026, compared with 38 in June 2025. That represents a decline of 7.9%.
However, year-to-date attached listing activity increased:
- 197 new listings through June 2025.
- 222 through June 2026.
- An increase of 12.7%.
This is essentially the reverse of the detached-home pattern.
Detached listings increased during June but were down year to date. Attached listings declined during June but were up year to date.
The greater number of condominium and townhome listings during the first six months of 2026 gave attached-property buyers more opportunities to compare floor plans, locations, building amenities, monthly association fees, parking arrangements, rental restrictions, and property condition.
For sellers, the additional year-to-date competition means presentation and pricing are especially important.
Attached Pending Sales Increased 50%
Twenty-four attached properties entered escrow in June 2026, compared with 16 in June 2025.
That represents an increase of 50%.
Year-to-date pending sales were also higher:
- 95 through June 2025.
- 108 through June 2026.
- An increase of 13.7%.
This is a healthy demand signal. Buyers were absorbing a larger number of attached listings even though more attached inventory had entered the market during the first half of the year.
The increase may reflect continued demand from buyers who want to live near the coast but are unwilling or unable to pay detached-home prices approaching or exceeding $2 million.
Attached properties can also appeal to:
- First-time coastal buyers.
- Second-home purchasers.
- Investors.
- Downsizing homeowners.
- Buyers seeking lower exterior-maintenance responsibilities.
- Buyers prioritizing proximity to the beach over lot size.
Demand within the attached segment can vary considerably depending on homeowners association costs, rental rules, building condition, financing eligibility, parking, views, and walkability.
Attached Closed Sales Increased 21.1%
Twenty-three attached homes closed escrow in June 2026, compared with 19 in June 2025.
That represents an increase of 21.1%.
Year-to-date attached sales were even stronger:
- 89 sales through June 2025.
- 102 sales through June 2026.
- An increase of 14.6%.
Unlike the detached category, where year-to-date sales were nearly flat, the attached market experienced a meaningful increase in transaction volume during the first half of the year.
This suggests that the condominium and townhome segment is functioning as an important source of market activity in 92109.
It also indicates that the increase in attached listings has not overwhelmed buyer demand. More properties were listed, but more properties were also placed under contract and successfully closed.
Attached Median Sales Price Reached $1.14 Million
The median attached-home sales price rose from $1,045,000 in June 2025 to $1,140,000 in June 2026.
That was an increase of:
- $95,000.
- 9.1%.
The year-to-date median increased more modestly:
- $1,022,500 through June 2025.
- $1,043,500 through June 2026.
- An increase of 2.1%.
The contrast between the monthly and year-to-date numbers suggests June may have included a stronger concentration of higher-priced attached sales.
For example, the monthly median can rise when more oceanfront, bayfront, recently remodeled, newer, larger, or highly amenitized properties close during a particular month.
The year-to-date increase of 2.1% provides a more restrained picture of attached-home appreciation. It indicates that values were still rising, but at a slower pace than the detached market.
The attached median remained less than half of the detached median in June:
- Detached median: $2,450,000.
- Attached median: $1,140,000.
- Difference: $1,310,000.
That pricing gap helps explain why condominiums and townhomes remain an important part of the buyer market in Pacific Beach and Mission Beach.
Attached Sellers Received 97.7% of Original List Price
Attached properties sold for an average of 97.7% of their original list price in June 2026, compared with 94.4% in June 2025.
This was an improvement of 3.5%.
The increase shows attached-home sellers had stronger negotiating leverage than they did one year earlier.
However, attached sellers still received a lower percentage of asking price than detached sellers:
- Detached: 99.7%.
- Attached: 97.7%.
This two-percentage-point difference may appear small, but at Pacific Beach and Mission Beach prices it can be meaningful.
On an original list price of $1.2 million:
- 99.7% would equal approximately $1,196,400.
- 97.7% would equal approximately $1,172,400.
- The difference would be about $24,000.
Year to date, attached properties received 96.7% of their original list price, nearly unchanged from 96.9% during the first half of 2025.
This indicates that attached sellers still need to price carefully. Buyers have shown a willingness to purchase, but they also have enough alternatives to negotiate when a property appears overpriced or requires substantial updating.
Attached Homes Averaged 36 Days on Market
The average attached property took 36 days to sell in June 2026, compared with 34 days in June 2025.
That was an increase of 5.9%.
Year-to-date marketing time increased from 34 days to 38 days, an increase of 11.8%.
The increase was considerably smaller than in the detached market.
Attached homes were therefore taking slightly longer to sell, but the change was not dramatic. This is consistent with a relatively balanced segment where buyers remain active but are able to compare several options before making a decision.
Association documentation can also affect attached-property transaction timing. Buyers and lenders may need to review:
- Homeowners association budgets.
- Reserve funding.
- Insurance coverage.
- Pending litigation.
- Special assessments.
- Owner-occupancy levels.
- Rental restrictions.
- Building maintenance.
- Delinquency rates.
- Meeting minutes.
These factors can affect both buyer interest and a property’s ability to qualify for conventional financing.
Attached Inventory Remained at Four Months
There were 67 attached homes available for sale in June 2026, compared with 65 in June 2025.
Inventory increased by 3.1%.
The months’ supply of inventory remained unchanged at four months.
This is materially different from the detached market’s 2.8-month supply.
A four-month supply suggests a more balanced environment. Well-priced, desirable properties can still sell quickly, but buyers are generally less pressured than they are in the detached-home category.
The attached market is not oversupplied based on this report. Pending and closed sales both increased substantially, demonstrating that the market is absorbing available inventory.
However, sellers should expect buyers to scrutinize price, condition, monthly association fees, reserves, insurance, parking, and building quality.
Detached Versus Attached Market Comparison
Pricing
Detached homes commanded a major premium.
| June 2026 Metric | Detached Homes | Condos and Townhomes |
|---|---|---|
| Median sales price | $2,450,000 | $1,140,000 |
| Year-over-year price change | +18.9% | +9.1% |
| Year-to-date median price | $2,360,000 | $1,043,500 |
| Year-to-date price change | +13.7% | +2.1% |
Detached prices rose at more than twice the monthly percentage rate of attached prices.
Sales Activity
| June 2026 Metric | Detached Homes | Condos and Townhomes |
|---|---|---|
| New listings | 22 | 35 |
| Pending sales | 18 | 24 |
| Closed sales | 19 | 23 |
| Pending sales change | +100.0% | +50.0% |
| Closed sales change | +35.7% | +21.1% |
Both segments experienced stronger buyer activity, but detached pending sales posted the largest increase.
Seller Negotiating Strength
| June 2026 Metric | Detached Homes | Condos and Townhomes |
|---|---|---|
| Original list price received | 99.7% | 97.7% |
| Days on market | 34 | 36 |
| Months of supply | 2.8 | 4.0 |
Detached sellers had the stronger negotiating position. They received a higher percentage of their original list price and competed against substantially less inventory.
What the Price Charts Show
The rolling 12-month median-price charts on the report provide useful long-term context.
The single-family chart shows that detached-home values in ZIP code 92109 rose substantially from 2020 through approximately 2024. Prices then moderated or leveled off before turning upward again toward 2026. The latest portion of the chart shows renewed strength and a clear separation between the 92109 median and the broader San Diego MLS median.
The townhouse-condominium chart shows a similar long-term rise from 2020 through 2024. Attached prices then softened from their peak before beginning to recover near the most recent portion of the chart.
These charts reinforce several conclusions:
- Pacific Beach and Mission Beach continue to command a substantial coastal premium.
- Detached homes have demonstrated stronger recent price momentum.
- Attached values remain below their prior high point on a rolling basis but appear to be stabilizing or moving upward.
- The gap between 92109 prices and the broader San Diego market remains significant.
Because these are rolling 12-month calculations, they are less volatile than a single month’s median and provide a broader view of the market’s direction. The charts appear at the bottom of page one of the report.
What This Market Means for Pacific Beach and Mission Beach Sellers
Detached-Home Sellers
The June data is highly favorable for detached-home owners considering a sale.
Sellers benefited from:
- A median sales price of $2.45 million.
- A 13.7% increase in the year-to-date median.
- A 24.4% reduction in available inventory.
- A 2.8-month housing supply.
- An average sale price equal to 99.7% of original asking price.
- A 100% increase in pending sales.
These conditions create a strong opportunity, but they do not eliminate the need for careful preparation.
Detached homes took an average of 34 days to sell, and year-to-date sellers received only 96.8% of their original list price. This indicates that buyers will respond to value but may resist aspirational pricing.
The strongest results are likely to come from homes that are:
- Priced according to recent comparable sales.
- Professionally presented.
- Properly photographed.
- Clear about parking, additions, permits, and property condition.
- Marketed to both local and out-of-area coastal buyers.
- Positioned around their specific lifestyle and redevelopment advantages.
A seller should not base a price solely on the June median. The median is a market-wide midpoint, not an estimate of any particular home’s value.
Condominium and Townhome Sellers
Attached-property sellers are also operating in an active market, but they face more competition.
The positive indicators include:
- A 50% increase in pending sales.
- A 21.1% increase in closed sales.
- A June median of $1.14 million.
- A 9.1% annual increase in the monthly median.
- Sellers receiving 97.7% of original asking price.
However, the four-month inventory supply gives buyers more choice.
Attached sellers should pay particular attention to:
- Comparable sales in the same building or immediate area.
- Monthly homeowners association dues.
- Upcoming assessments.
- Parking and storage.
- Rental restrictions.
- Building insurance.
- Reserve funding.
- Interior updates.
- View orientation.
- Outdoor space.
- Financing eligibility.
Two condominiums with similar square footage can have very different values due to location within the building, views, noise exposure, parking, floor level, condition, association strength, and rental rules.
What This Market Means for Buyers
Detached-Home Buyers
Detached buyers should be prepared for competition.
The available supply fell to 2.8 months, pending sales doubled, and June sellers received nearly 100% of their original asking price.
Buyers should have:
- Current financing approval.
- Verified funds for the down payment and closing costs.
- A clear understanding of their preferred micro-location.
- A strategy for inspections and contingencies.
- Realistic expectations regarding pricing.
- A plan for evaluating remodeling or redevelopment potential.
A low offer may still be appropriate for an overpriced property, but it may be ineffective on a newly listed home that is well positioned and receiving strong activity.
Buyers should also investigate insurance availability, flood considerations, coastal conditions, zoning, permits, and any property-specific rental or redevelopment issues before removing contingencies.
Condominium and Townhome Buyers
Attached buyers have more leverage than detached buyers, but they should not interpret the four-month supply as a weak market.
Pending and closed sales increased substantially, and median prices rose.
The greater selection allows buyers to compare properties carefully, but the most desirable units can still sell quickly.
Before purchasing, buyers should review the full association package and evaluate:
- Financial reserves.
- Insurance coverage and deductibles.
- Special assessments.
- Pending maintenance.
- Litigation.
- Rental restrictions.
- Pet restrictions.
- Parking rights.
- Storage rights.
- Short-term rental rules.
- Owner-occupancy ratios.
- Recent meeting minutes.
A low monthly payment should not be evaluated independently of association dues, taxes, insurance, maintenance, and possible assessments.
July 2026 Market Outlook
Based on June’s activity, Pacific Beach and Mission Beach entered July with positive momentum.
The strongest forward-looking indicators are:
- Detached pending sales doubled.
- Attached pending sales rose 50%.
- Closed sales increased in both categories.
- Median prices rose in both categories.
- Detached inventory remained constrained.
- Sellers received a higher share of their original asking price.
The elevated level of pending sales could support additional closings during July and August.
For detached homes, continued low inventory may keep upward pressure on prices, particularly for remodeled homes, well-located properties, homes with parking, and residences offering ocean, bay, or coastal lifestyle appeal.
For attached properties, the outlook is more balanced. Buyers have additional choices, but rising pending and closed sales indicate that demand remains sufficient to absorb inventory.
The principal issue to monitor will be whether new listings increase meaningfully during the summer. If detached inventory remains near current levels while buyer demand continues, sellers may retain significant leverage. If attached inventory rises faster than sales, attached sellers could face greater pricing competition.
Final Market Assessment
The June 2026 Pacific Beach and Mission Beach real estate market was active, expensive, and generally favorable to sellers.
The detached-home market was the strongest segment. Prices increased sharply, pending sales doubled, inventory fell, and sellers received nearly the full amount of their original asking prices. With only 2.8 months of supply, detached homes were firmly positioned in a seller-favorable environment.
The condominium and townhome market was also healthy. Sales activity increased, prices rose, and more properties successfully closed. However, a four-month inventory supply and a lower original-list-price percentage gave buyers more room to compare and negotiate.
The most important takeaway is that Pacific Beach and Mission Beach should not be viewed as one uniform market.
Property type, condition, parking, views, proximity to the ocean or bay, redevelopment potential, association quality, rental restrictions, and exact location can all produce substantial differences in value and marketability.
For sellers, the market offers an excellent opportunity, particularly in the detached category, but accurate pricing remains essential.
For buyers, competition is real, especially for detached homes, but opportunities still exist for those who are well prepared and able to distinguish between a desirable property and an overpriced one.
June’s numbers show that demand for the Pacific Beach and Mission Beach lifestyle remains strong as the market moves through the summer of 2026.
