Otay Ranch Real Estate
Market Update 2026 August
A detailed analysis of July 2026 housing activity
| THE JULY STORY Detached homes showed strong buyer follow-through, with pending sales up 38.9% and closed sales up 14.3% year over year. Attached homes moved in the opposite direction, with pending sales and closings both lower and a substantially slower year-to-date selling pace. |
Prepared in August 2026 from July 2026 market data
Market area: ZIP code 91913 / Otay Ranch

Executive Summary
The July 2026 housing market serving Otay Ranch was not one uniform market. It was a two-speed market divided by property type. Detached homes posted stronger contract and closing activity than one year earlier, while attached homes—condominiums and townhomes—recorded a significant pullback in new listings, pending sales, and completed sales. That split matters because a broad statement such as “the Otay Ranch market is up” or “the market is slowing” would miss what buyers and sellers were actually experiencing.
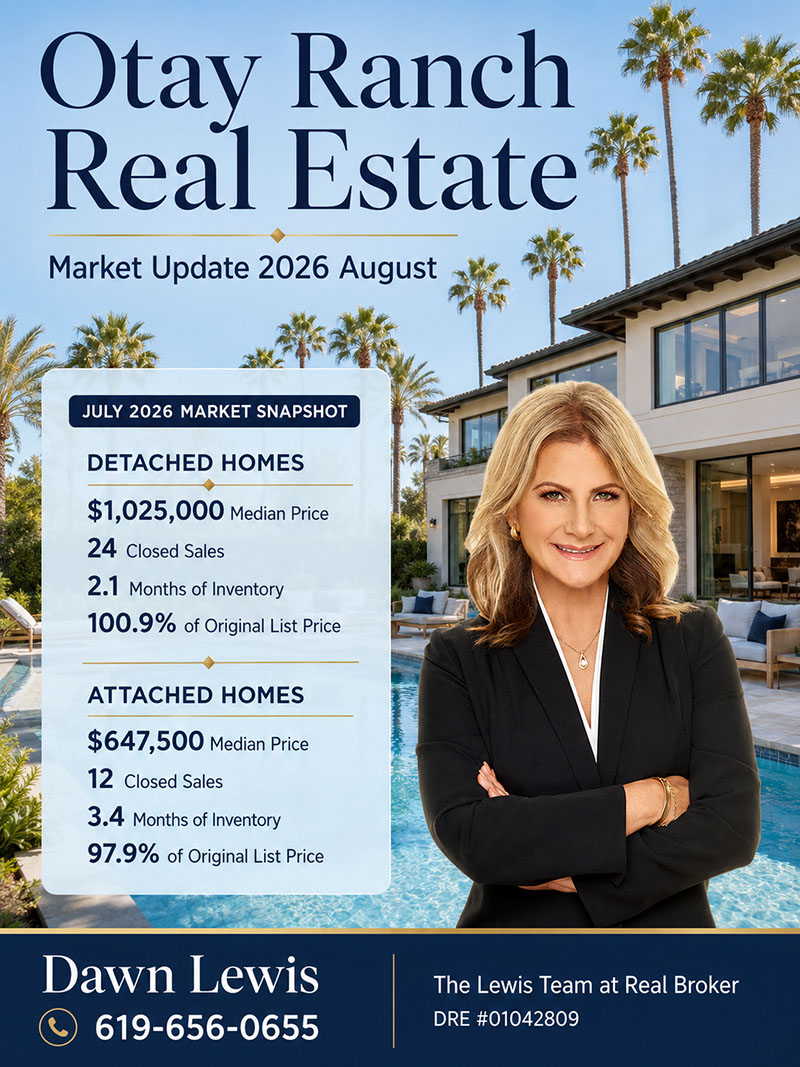
For detached homes, buyers remained active despite slightly softer pricing. July produced 25 pending sales, up 38.9% from 18 in July 2025, and 24 closed sales, up 14.3% from 21. The median sale price eased 1.4% to $1,025,000, yet sellers received an average measure equal to 100.9% of original list price. Inventory was 23.4% lower than a year earlier and months of supply fell from 3.9 to 2.1 months. Together, those indicators describe a competitive detached-home segment with constrained choice and strong execution on properly positioned listings.
For attached homes, July activity was much quieter. New listings fell 33.3%, pending sales fell 50.0%, and closed sales fell 20.0% compared with July 2025. The July median price declined 5.1% to $647,500. Attached inventory remained below last year, but months of supply was 3.4 months—meaningfully higher than the detached segment’s 2.1 months. Sellers received 97.9% of original list price, a sign that attached-home buyers generally had more room to negotiate.
|
BOTTOM LINE Detached sellers entered August with the stronger negotiating position. Attached-home sellers faced a more price-sensitive audience and needed sharper pricing, presentation, and buyer-incentive strategy. Buyers needed to calibrate their approach to the specific property type rather than relying on a ZIP-code-wide headline. |
At-a-Glance Market Scorecard
|
Metric |
Detached – Jul. 2026 |
YoY change |
Attached – Jul. 2026 |
YoY change |
|
New listings |
32 |
-8.6% |
26 |
-33.3% |
|
Pending sales |
25 |
+38.9% |
12 |
-50.0% |
|
Closed sales |
24 |
+14.3% |
12 |
-20.0% |
|
Median sale price |
$1,025,000 |
-1.4% |
$647,500 |
-5.1% |
|
Original list price received |
100.9% |
+2.9% |
97.9% |
+0.9% |
|
Days on market |
38 |
+18.8% |
46 |
-8.0% |
|
Homes for sale |
49 |
-23.4% |
54 |
-12.9% |
|
Months of inventory |
2.1 |
-46.2% |
3.4 |
-5.6% |
Detached Homes: Demand Accelerated as Supply Tightened
New listings and available inventory
Thirty-two detached homes came to market in July, down 8.6% from 35 a year earlier. That modest decline in new supply became more important when viewed alongside the 49 detached homes available for sale, down 23.4% from 64. The result was only 2.1 months of inventory, a 46.2% decline from 3.9 months in July 2025. In practical terms, the market offered buyers fewer alternatives and gave correctly priced sellers less direct competition.
A 2.1-month supply generally signals a seller-leaning environment, but it does not mean every home will sell quickly or above asking. Condition, location within the community, lot orientation, upgrades, monthly fees, Mello-Roos obligations, solar arrangements, and initial pricing can create large differences between otherwise similar properties. Scarcity helps, but it does not erase overpricing.
Pending and closed sales
Pending sales increased to 25 from 18, a 38.9% year-over-year gain. Because pending sales reflect accepted contracts, this was one of July’s strongest forward-looking signals. Closed sales increased to 24 from 21, a 14.3% gain. The simultaneous improvement in pendings and closings suggests that detached demand was not merely theoretical: buyers were writing offers and transactions were reaching completion.
Year to date, the improvement was even clearer. Through July, detached pending sales rose 26.4% to 158, while closed sales rose 25.9% to 146. Those gains occurred even though the year-to-date median price was 2.2% lower than in the comparable 2025 period. More homes were trading, but buyers were not simply bidding the typical price higher across the board.
Prices, list-price performance, and market time
The July detached median sale price was $1,025,000, down 1.4% from $1,040,000 in July 2025. Through July, the median was $1,015,000, down 2.2% from $1,037,538. These modest declines indicate price normalization rather than a collapse, especially when paired with rising transaction volume and reduced inventory. The median is also affected by the mix of homes sold; a greater share of smaller or less-upgraded properties can lower the median even if individual comparable values are stable.
Detached sellers received 100.9% of original list price in July, up from 98.1% one year earlier. Year to date, the figure was 100.2%, up from 99.5%. This is a strong signal of pricing power, but the source notes that the calculation does not account for seller concessions or down-payment assistance. A home can close at or above the original list price while the seller still provides a credit toward closing costs or an interest-rate buydown.
Days on market increased from 32 to 38 in July, an 18.8% increase, and rose from 29 to 32 year to date. This apparent tension—longer marketing time alongside stronger list-price performance—can occur when buyers take more time to compare options, when some listings begin too aggressively, or when the homes that eventually close include previously stale inventory. The lesson is that demand was healthy but selective.
Attached Homes: A More Negotiable, Price-Sensitive Segment
A sharp contraction in monthly activity
The attached-home segment experienced a broad slowdown in July. New listings fell to 26 from 39, pending sales fell to 12 from 24, and closed sales fell to 12 from 15. The 50.0% decline in pending sales is especially notable because it points to fewer contracts likely to feed near-term closings. Small monthly samples can create large percentage swings, but the direction was consistent across all three activity measures.
The year-to-date figures confirm that July was not solely a one-month anomaly. Through July, attached new listings were down 20.2%, pending sales were down 16.3%, and closed sales were down 7.8%. Buyers and sellers were participating less frequently than in the first seven months of 2025.
Price and negotiating conditions
The attached median sale price was $647,500 in July, down 5.1% from $682,000. However, the year-to-date median was $660,000, up 1.5% from $650,000. This contrast is important: July alone was softer, but the broader seven-month price picture remained slightly positive. It would be inaccurate to treat one month’s median decline as proof that every condominium or townhome lost 5.1% of value.
Sellers received 97.9% of original list price in July, compared with 97.0% a year earlier. While that ratio improved, it remained three percentage points below the detached segment. At a hypothetical $650,000 original list price, a three-point difference equals roughly $19,500 before accounting for concessions. This illustrates why attached-home sellers should leave room for a realistic negotiation strategy and why buyers may find more leverage in this segment.
Attached homes sold in 46 days in July, four days faster than the 50-day pace a year earlier. Yet year-to-date market time increased sharply from 42 to 53 days, a 26.2% rise. The July improvement therefore should be viewed as a positive monthly development within a slower year-to-date environment—not as proof that the segment had fully accelerated.
Inventory
There were 54 attached homes for sale, down 12.9% from 62, while months of supply edged down from 3.6 to 3.4. Unlike detached inventory, which tightened dramatically, attached supply remained much closer to last year’s level relative to sales. A 3.4-month supply still is not an oversupplied market, but it gives buyers more comparative choice and usually rewards listings that are priced and presented precisely.
What the Rolling Price Charts Suggest
The report’s rolling 12-month median-price charts place July’s numbers in a longer context. For single-family homes in 91913, the local rolling median rose substantially from 2020 through 2022, paused and fluctuated during 2022–2023, then climbed again through 2024 and into 2025. More recently, the local line appears relatively level just below the broader MLS benchmark. That visual pattern supports the interpretation of stabilization at a high price level rather than an abrupt breakdown.
For townhomes and condominiums, the 91913 rolling line rose from the low-$400,000 range in 2020 toward the mid-$600,000 range by 2024–2025, then flattened. By the latest period, the local and broader MLS lines were close to one another. The attached market therefore entered mid-2026 with values broadly holding near their recent plateau, even as July’s sales activity softened.

|
ANALYTICAL CAUTION Rolling 12-month medians smooth short-term volatility and are useful for identifying trend direction. Monthly medians react faster but are more sensitive to the mix and small number of homes sold. Neither measure replaces a property-specific comparative market analysis. |
What This Means for Otay Ranch Sellers
· Detached-home sellers can price with confidence, but not complacency. Low supply and strong pending activity support assertive positioning when recent comparable sales, upgrades, condition, lot, and location justify it.
· Attached-home sellers should compete deliberately. With a 3.4-month supply, 97.9% original-list-price ratio, and lower pending activity, the first two weeks of market exposure are critical.
· Price to create urgency, not to “test” the market. An inflated launch price can cost the listing its most valuable exposure period and may lead to later reductions that buyers interpret as weakness.
· Prepare for payment-sensitive buyers. HOA dues, special assessments, Mello-Roos, insurance costs, solar payments, and interest rates all affect affordability beyond the sale price.
· Use concessions strategically. A credit for closing costs or a temporary rate buydown may protect the headline price while solving the buyer’s monthly-payment problem. Net proceeds—not just sale price—should guide the decision.
· Make the property easy to choose. Repairs, professional cleaning, staging, photography, accurate disclosures, and clear documentation of upgrades can separate a home from nearby alternatives.
What This Means for Otay Ranch Buyers
· Detached-home buyers should be financially and operationally ready. With only 2.1 months of supply and strong pending activity, a well-priced home may attract early competition.
· A strong offer is more than price. Verified financing, a credible deposit, realistic contingency periods, and flexible timing can improve acceptance odds without creating unnecessary risk.
· Attached-home buyers may have more negotiating room. The lower list-price ratio and softer pending-sales count support asking for price adjustments, credits, or repairs when the property’s market history and condition justify them.
· Review the complete ownership cost. Evaluate HOA budgets and reserves, meeting minutes, insurance, pending litigation, rental restrictions, special assessments, Mello-Roos, solar terms, and any community-specific obligations.
· Do not negotiate from ZIP-code medians alone. A home’s value depends on the closest and most recent comparable properties, adjusted for square footage, condition, location, view, lot, parking, upgrades, and community fees.
Otay Ranch Community and Lifestyle Perspective
Otay Ranch is one of South County San Diego’s most recognizable master-planned areas, known for a broad mix of detached residences, townhomes, condominiums, parks, trails, neighborhood centers, and newer commercial districts. Buyers are often drawn to the community because it offers a suburban residential setting with access to shopping, dining, recreation, and major employment and transportation corridors in the South Bay.
The diversity of housing is a major strength, but it also means the phrase “Otay Ranch market” covers many different micro-markets. A newer detached home with a larger lot and modern upgrades does not compete directly with an older condominium, and two similarly sized homes can have different values because of HOA structure, Mello-Roos, view orientation, street position, solar ownership, remodeling, or proximity to amenities. Market expertise in Otay Ranch therefore requires neighborhood-level and property-level analysis—not just a ZIP code average.
For sellers, the community’s amenities and planned character should be translated into a lifestyle story supported by accurate property facts. For buyers, the decision should balance the home itself with recurring costs, commute patterns, community rules, future plans, and the specific neighborhood’s supply and recent comparable sales.
Outlook for August 2026
The detached segment entered August with favorable momentum: fewer homes for sale, more contracts, more closings, and sellers receiving approximately the original list price or better. If new supply remains restrained, competitively priced detached listings should continue to receive strong attention. The primary risks are payment sensitivity and overpricing, both of which can lengthen market time even when inventory is limited.
The attached segment entered August with a more cautious outlook. Reduced pending activity could translate into fewer late-summer closings, while the 3.4-month supply gives buyers a wider negotiating field than in the detached segment. Sellers who respond quickly to showing feedback and competing inventory will be better positioned than those anchored to peak-era pricing or to a neighbor’s non-comparable sale.
For both segments, mortgage-rate movement, consumer confidence, new inventory, seller concessions, and the mix of homes sold will shape the next report. The most reliable strategy remains property-specific: combine current competition, recent comparable sales, condition, ownership costs, and buyer feedback rather than relying on a single market statistic.
Complete July and Year-to-Date Data
Detached homes
|
Metric |
Jul. 2025 |
Jul. 2026 |
Change |
YTD 2025 |
YTD 2026 |
Change |
|
New listings |
35 |
32 |
-8.6% |
220 |
231 |
+5.0% |
|
Pending sales |
18 |
25 |
+38.9% |
125 |
158 |
+26.4% |
|
Closed sales |
21 |
24 |
+14.3% |
116 |
146 |
+25.9% |
|
Median sale price |
$1,040,000 |
$1,025,000 |
-1.4% |
$1,037,538 |
$1,015,000 |
-2.2% |
|
Original list price received |
98.1% |
100.9% |
+2.9% |
99.5% |
100.2% |
+0.7% |
|
Days on market |
32 |
38 |
+18.8% |
29 |
32 |
+10.3% |
|
Inventory |
64 |
49 |
-23.4% |
— |
— |
— |
|
Months of inventory |
3.9 |
2.1 |
-46.2% |
— |
— |
— |
Attached homes
|
Metric |
Jul. 2025 |
Jul. 2026 |
Change |
YTD 2025 |
YTD 2026 |
Change |
|
New listings |
39 |
26 |
-33.3% |
223 |
178 |
-20.2% |
|
Pending sales |
24 |
12 |
-50.0% |
129 |
108 |
-16.3% |
|
Closed sales |
15 |
12 |
-20.0% |
116 |
107 |
-7.8% |
|
Median sale price |
$682,000 |
$647,500 |
-5.1% |
$650,000 |
$660,000 |
+1.5% |
|
Original list price received |
97.0% |
97.9% |
+0.9% |
99.1% |
99.5% |
+0.4% |
|
Days on market |
50 |
46 |
-8.0% |
42 |
53 |
+26.2% |
|
Inventory |
62 |
54 |
-12.9% |
— |
— |
— |
|
Months of inventory |
3.6 |
3.4 |
-5.6% |
— |
— |
— |
Methodology, Geography, and Important Notes
This report was prepared in August 2026 from the Greater San Diego Association of REALTORS® Local Market Update for July 2026. The source report identifies the statistical area as ZIP code 91913, “Chula Vista.” This report uses that dataset as a practical market proxy for Otay Ranch because Otay Ranch is a major component of 91913; however, the source is not labeled as an Otay-Ranch-only boundary extract and may include transactions in adjacent 91913 neighborhoods. Property-specific decisions should use a narrower comparative market analysis.
All source data is from the San Diego MLS and was current as of August 5, 2026. Percent changes are calculated using rounded figures and can appear extreme when sample sizes are small. Median price is the midpoint of sales, not the average and not a measure of the appreciation of an individual home. The “percent of original list price received” statistic does not account for seller concessions and/or down-payment assistance. Pending sales can fail to close or close in a later period. Market information is deemed reliable but should be independently verified.
Final Expert Takeaway
July 2026 rewarded precision. Detached-home sellers benefited from scarce supply and strong buyer follow-through, while attached-home sellers operated in a slower, more negotiable environment. Buyers who treated those segments differently—and sellers who aligned price and presentation with their true competitive set—were best positioned to succeed. In Otay Ranch, the winning strategy is not a generic citywide opinion; it is a detailed reading of the specific neighborhood, property type, ownership costs, condition, and current competition.