Eastlake and Windingwalk
Real Estate Market Update 2026 August
A detailed analysis of July 2026 detached and attached home activity
|
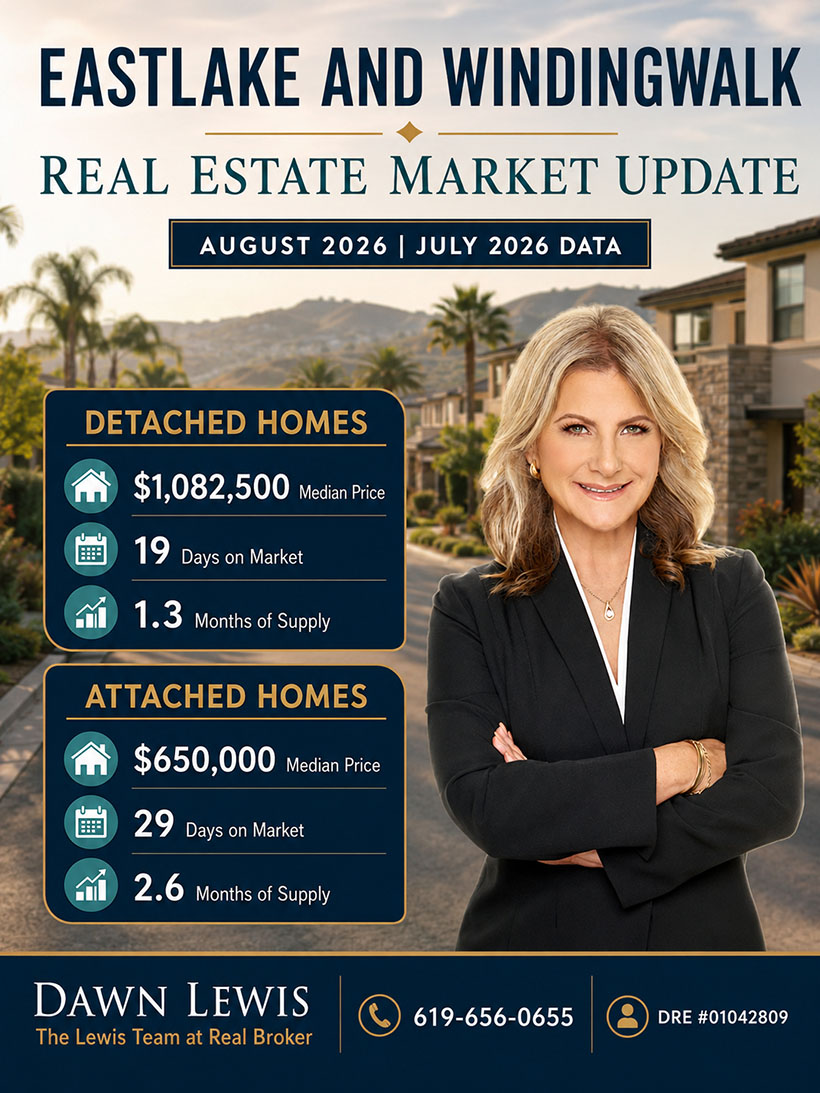
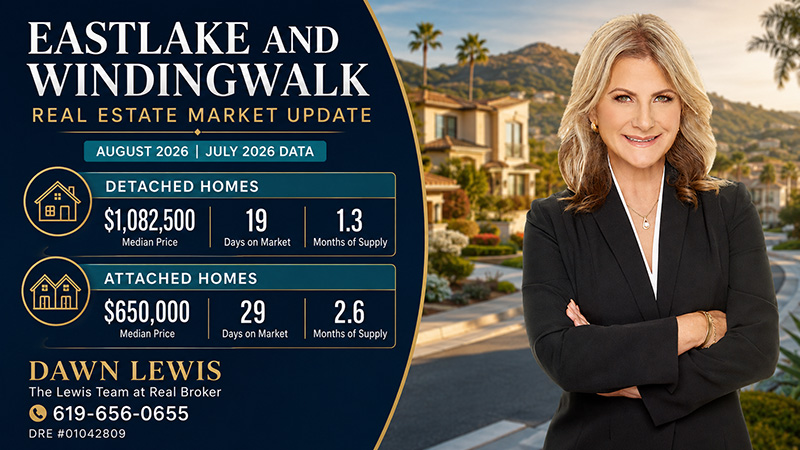
Market at a glance Detached homes were the tightest and fastest-moving segment: the July median reached $1,082,500, homes sold in 19 days, and supply fell to 1.3 months. Attached homes recorded twice as many closings as a year earlier and sold in 29 days, yet their median price declined to $650,000. The 91915 market was active, but it was not uniform. |
Prepared for homeowners, buyers, sellers, and investors
Dawn Lewis | The Lewis Team at Real Broker | DRE #01042809
Executive Summary
The July 2026 data for ZIP code 91915 tells a story of constrained supply, improving transaction speed, and sharply different pricing behavior between detached houses and attached townhome-condominium properties. Buyers remained active even though fewer homes came to market. Sellers generally captured nearly all—or slightly more than all—of their original asking prices, but the strength varied by property type.

Detached homes delivered the clearest seller-favorable indicators. New listings fell 52.2% from July 2025, leaving only 13 homes for sale and 1.3 months of inventory. At the same time, pending sales rose 62.5%, closings rose 16.7%, and the median price increased 21.6% to $1,082,500. The typical detached sale took 19 days, 23 days faster than a year earlier, and sellers received 99.7% of original list price on average.
The attached segment was more balanced but still competitive. New listings declined 40.0%; 16 properties closed, double the July 2025 count; and days on market fell from 51 to 29. Yet the median sales price declined 4.9% to $650,000. This is not evidence that every condominium or townhome lost value. With only 16 July closings, changes in the mix of floor plans, condition, location, HOA structure, and price tiers can move the median materially.
|
Bottom line July favored well-prepared sellers, especially in the detached segment. Buyers still had opportunities—particularly among attached homes—but low inventory and faster market times made financing readiness, accurate comparable-sale analysis, and decisive offer strategy especially important. |
July 2026 Market Dashboard
Detached homes
|
Metric |
July 2025 |
July 2026 |
Year-over-year change |
|
New listings |
23 |
11 |
-52.2% |
|
Pending sales |
8 |
13 |
+62.5% |
|
Closed sales |
12 |
14 |
+16.7% |
|
Median sales price |
$889,850 |
$1,082,500 |
+21.6% |
|
Original list price received |
99.0% |
99.7% |
+0.7% |
|
Days on market |
42 |
19 |
-54.8% |
|
Homes for sale |
32 |
13 |
-59.4% |
|
Months of supply |
3.2 |
1.3 |
-59.4% |
Attached homes: townhomes and condominiums
|
Metric |
July 2025 |
July 2026 |
Year-over-year change |
|
New listings |
25 |
15 |
-40.0% |
|
Pending sales |
12 |
12 |
0.0% |
|
Closed sales |
8 |
16 |
+100.0% |
|
Median sales price |
$683,500 |
$650,000 |
-4.9% |
|
Original list price received |
95.9% |
100.4% |
+4.7% |
|
Days on market |
51 |
29 |
-43.1% |
|
Homes for sale |
40 |
32 |
-20.0% |
|
Months of supply |
3.9 |
2.6 |
-33.3% |
Data note: Percent of original list price does not account for seller concessions or down-payment assistance. Percentage changes use rounded figures and can appear extreme when sample sizes are small.
Detached-Home Analysis
Supply tightened dramatically
Only 11 detached homes entered the market in July, compared with 23 one year earlier. Active inventory fell from 32 to 13 properties, and months of supply dropped from 3.2 to 1.3. Months of supply estimates how long current inventory would take to sell at the prevailing sales pace if no additional homes were listed. At 1.3 months, buyers had a limited selection and sellers faced comparatively little direct competition.
The relationship between new listings and closed sales is also revealing: 11 new detached listings arrived while 14 sales closed. That does not mean the same homes were listed and sold within July, but it does show that completed demand outpaced that month’s fresh supply. If that pattern persisted, inventory would remain under pressure.
Demand accelerated despite fewer choices
Pending sales increased from 8 to 13, a 62.5% gain, while closed sales rose from 12 to 14. The pending figure is forward-looking because it reflects properties that entered contract but had not necessarily closed by month-end. In combination with declining supply, the increase suggests that qualified buyers were willing to act when desirable detached homes became available.
Price and negotiation leverage
The detached median sales price rose to $1,082,500 from $889,850, a 21.6% year-over-year increase. Year to date through July, the median was $1,010,200, up 10.1% from $917,250 in the same period of 2025. The year-to-date measure smooths some of the volatility in a single month and still indicates meaningful appreciation.
Sellers received 99.7% of original list price in July, up from 99.0%. Year to date, the figure was 100.1%. This does not mean every home sold at or above asking, and it does not account for concessions. It does mean that the segment, in aggregate, offered little room for broad discounts from original asking price. Correctly priced, well-presented homes were positioned to attract serious attention early.
Speed of sale
Days on market fell from 42 to 19, a 54.8% reduction. Year to date, detached homes averaged 23 days, seven days faster than in 2025. A shorter marketing period can compress the buyer’s decision window. For sellers, it raises the importance of completing repairs, disclosures, photography, pricing analysis, and launch marketing before the property goes active rather than trying to catch up after showings begin.
Attached-Home Analysis
More closings, less new supply
The attached market produced 16 closed sales, exactly twice July 2025’s total, even though new listings fell from 25 to 15. Pending sales were unchanged at 12. Active inventory declined 20.0% to 32 properties and supply fell from 3.9 to 2.6 months. Compared with detached homes, attached buyers had more relative selection, but the segment was still moving faster and carrying less supply than a year earlier.
Why the median price moved lower
The July attached median was $650,000, down 4.9% from $683,500. Year to date, the median was $685,000, down 2.1%. These figures should be interpreted as the midpoint of the homes that sold—not as an appraisal of every townhome or condominium in Eastlake or Windingwalk. A month with more smaller units, different bedroom counts, older interiors, varied parking, or higher recurring ownership costs can produce a lower median even when individual comparable homes remain stable.
The segment’s other indicators were stronger than the median alone suggests. Sellers received 100.4% of original list price, up from 95.9%, and market time fell from 51 to 29 days. Those numbers are consistent with effective demand for correctly priced attached properties. The more useful question for a specific owner is how that property compares with the closest recent sales by complex, floor plan, size, condition, garage configuration, outdoor space, view or location influence, HOA dues, and special-tax burden.
A selective rather than weak attached market
Attached housing can serve buyers seeking a lower acquisition price than a detached home, but monthly carrying costs matter. Buyers increasingly compare the full payment—not just purchase price—including mortgage, property taxes, HOA dues, insurance, Mello-Roos or CFD charges where applicable, utilities, and any special assessment. A property that documents these costs clearly and presents well can compete strongly even when the segment’s median is lower.
Year-to-Date Perspective Through July
The seven-month totals show that 2026 activity was not simply a repeat of July. Detached closings were down 2.9% year to date, even though July closings were up 16.7%. Attached closings were up 18.8% year to date, reinforcing that the increased July volume was part of a broader improvement. The data therefore points to two distinct patterns: detached inventory scarcity supported higher prices, while attached properties generated greater transaction volume at a modestly lower median price.
· Detached: 88 new listings year to date, down 26.7%; 68 closings, down 2.9%; median price $1,010,200, up 10.1%.
· Attached: 126 new listings year to date, up 5.0%; 82 closings, up 18.8%; median price $685,000, down 2.1%.
· Market speed improved in both categories: detached days on market fell 23.3% year to date, and attached days fell 15.6%.
· Original list price received improved in both categories, indicating firmer execution even though pricing trends differed.
What the Market Means for Sellers
For detached-home sellers, the combination of 1.3 months of supply, rising pendings, a higher median, and 19 days on market creates a strong backdrop—but it does not eliminate the cost of overpricing. Buyers can recognize a home that is positioned above its comparable value, and an initial pricing mistake can cause a listing to miss the most active early exposure. The strongest launch strategy is property-specific and built around recent nearby sales, active competition, condition, improvements, lot and location characteristics, and current buyer response.
For attached-home sellers, the 100.4% original-list-price ratio and faster sales pace are encouraging, but buyers will scrutinize recurring expenses and complex-level considerations. A complete seller package should make it easy to understand upgrades, maintenance, parking, storage, outdoor space, HOA dues, amenities, insurance information made available by the association, solar obligations if any, and known special assessments or litigation disclosed through the proper documents.
· Prepare before launch: repairs, cleaning, staging, photography, disclosures, and document gathering should be complete before the first showing.
· Price from the closest true comparables, not from a broad ZIP-code median or an automated estimate.
· Build a first-week strategy that concentrates attention while preserving enough time for qualified buyers to review the property.
· Evaluate the net terms of each offer, including financing strength, contingencies, requested credits, appraisal risk, and closing timeline—not price alone.
What the Market Means for Buyers
Buyers in the detached segment should expect limited choices and a faster decision cycle. A full preapproval, verified funds, and a clear understanding of the target neighborhood should be completed before touring. With sellers receiving close to original list price, offers built around unsupported discounts may struggle when a home is accurately priced and in strong condition.
Attached-home buyers had more relative inventory at 2.6 months of supply. That may create additional room to compare complexes and total monthly costs, but the 29-day market time and 100.4% price-received ratio show that desirable properties were not sitting indefinitely. The best opportunity is not always the lowest asking price; it is often the property with the best combination of layout, condition, location, reserves and association health, insurance profile, parking, storage, and recurring cost.
· Review HOA governing documents, budgets, reserve information, meeting minutes, insurance, litigation, delinquency information, and any pending special assessments within the applicable review period.
· Confirm parcel-specific taxes and assessments rather than relying on a neighborhood generalization.
· Compare seller credits and interest-rate strategies by their effect on cash to close and monthly payment.
· Keep inspection and appraisal protections aligned with the property and financing; speed should come from preparation, not from ignoring risk.
Living in Eastlake and Windingwalk
Eastlake: a collection of planned neighborhoods
Eastlake is not a single uniform subdivision. It is a collection of planned neighborhoods and housing types across eastern Chula Vista, including detached homes, townhomes, and condominiums built in different eras and governed by different combinations of master and subassociations. That variety is part of the appeal: buyers can compare larger detached properties, lower-maintenance attached homes, parkside locations, gated enclaves, and homes near commercial and recreation destinations.
EastLake III reports that it serves more than 3,000 homes and emphasizes maintained common areas and resident amenities. The City of Chula Vista also maintains public recreation spaces in the area. Chula Vista Community Park on Eastlake Parkway is a 14.9-acre facility with ballfields, barbecue grills, open green space, play equipment, shelters, a soccer field, restrooms, and tennis courts. These neighborhood amenities contribute to the outdoor-oriented character many residents associate with eastern Chula Vista.
Windingwalk: recreation-centered neighborhood design
Windingwalk is a master-planned community within the 91915 market area characterized by a mix of detached and attached residences, landscaped streets, neighborhood recreation, and convenient access to nearby commercial corridors. Housing varies by enclave, so buyers should evaluate the exact association structure and amenities attached to a particular address rather than assuming every Windingwalk property carries identical rights, dues, or obligations.
Windingwalk Park, at 1675 Exploration Falls Drive, includes a picnic area, play areas, a tot lot, skate park, and tennis courts according to the City of Chula Vista. That combination supports a lifestyle in which everyday recreation is integrated into the neighborhood rather than requiring a long trip across town.
Shopping, dining, entertainment, and access
Otay Ranch Town Center at 2015 Birch Road is one of the area’s principal lifestyle destinations. Its official site describes a pedestrian-friendly, open-air center with more than 90 specialty stores as well as dining and entertainment. Residents also have access to grocery stores, services, restaurants, fitness businesses, and additional retail along Eastlake Parkway, Olympic Parkway, and nearby commercial areas.
Regional access is supported by major east-west and north-south routes serving eastern Chula Vista, including State Route 125 and connections toward Interstate 805. Actual commute time varies by destination, time of day, toll-road choice, and traffic conditions, so buyers should test the commute that matters to them rather than relying on a generalized estimate.
Ownership details matter from one property to the next
A buyer should never assume that two nearby Eastlake or Windingwalk homes have the same ownership costs. HOA dues, master-association and subassociation responsibilities, Mello-Roos or Community Facilities District assessments, insurance arrangements, solar agreements, and maintenance obligations can differ by parcel and development. These items can affect affordability, resale positioning, and lender approval. A careful purchase analysis therefore combines comparable value with a full review of recurring expenses and property-specific documents.
Expert Outlook for the Next Phase of 2026
If detached inventory remains near July’s 1.3-month level while pending demand stays firm, well-positioned homes should continue to receive early attention. The risk to that outlook would be a meaningful change in affordability, financing conditions, consumer confidence, or a sudden increase in listings. Because July included only 14 detached closings, the next several months should be monitored before assuming that a 21.6% monthly median-price increase represents a permanent new growth rate.
For attached homes, the central question is whether higher transaction volume continues while the median stabilizes. Supply at 2.6 months gives buyers somewhat more choice than in detached housing, but it is still far below a market characterized by abundant inventory. Complex-specific performance will remain essential. Updated units with desirable layouts, usable parking and storage, manageable recurring costs, and clear association documentation may perform differently from the ZIP-wide median.
|
Dawn Lewis’s market perspective The 91915 market rewards precision. Sellers should not price a detached home from a condominium statistic—or price a townhome from a broad Eastlake average. Buyers should not judge a property by price alone without calculating its full monthly cost. The winning strategy is built at the property level, using the closest comparables and the exact community, association, condition, and ownership-cost details. |
Methodology and Important Limitations
This report analyzes San Diego MLS activity for ZIP code 91915, which is used as a practical market area for Eastlake, Windingwalk, and surrounding eastern Chula Vista neighborhoods. ZIP-code statistics do not isolate every named subdivision, and not every property within 91915 is in Eastlake or Windingwalk. “Detached” and “attached” are MLS property categories; attached includes townhome and condominium sales. Median price is the midpoint of sales and is not the same as average price or a property appraisal.
July figures are monthly snapshots and may be influenced by small samples and changes in the mix of homes sold. Year-to-date figures cover January through July 2026 and provide useful context. Percent of original list price does not account for concessions or down-payment assistance. Market conditions can change quickly, and a property-specific comparative market analysis is necessary for pricing or offer decisions.
Prepared in August 2026 using July 2026 market data. This report is for general informational and marketing purposes and is not an appraisal, legal advice, tax advice, lending advice, or a prediction of future results