A Detailed Review of June 2026 Chula Vista Housing Activity in ZIP Codes 91910, 91911, 91913, 91914 and 91915
The Chula Vista housing market entered July 2026 with generally strong buyer demand, limited single-family-home inventory and meaningful differences from one ZIP code to another.
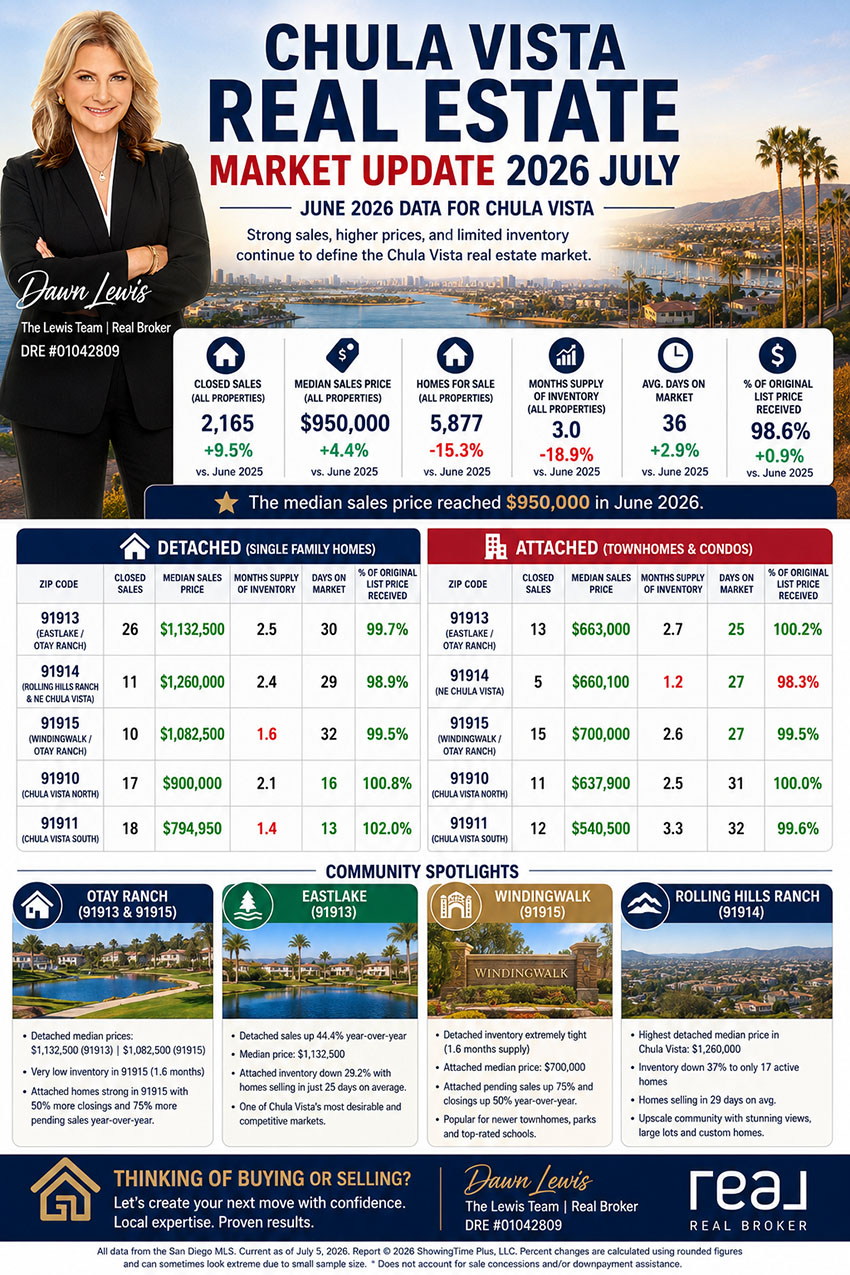
June’s data show that there is no single market condition that applies uniformly across Chula Vista. Detached homes in several areas sold quickly, frequently near or above their original asking prices and with fewer homes available than one year ago. The condominium and townhome market was more varied: some ZIP codes experienced rising prices and strong sales growth, while others had increasing inventory, longer marketing times or softer monthly median prices.
The eastern Chula Vista market—particularly areas associated with Otay Ranch, Eastlake, Windingwalk and Rolling Hills Ranch—continued to command some of the city’s highest prices. However, even within eastern Chula Vista, the data differed substantially among ZIP codes 91913, 91914 and 91915.
This report analyzes June 2026 activity in:
- 91910 — Chula Vista North
- 91911 — Chula Vista South
- 91913 — Chula Vista–Eastlake
- 91914 — Chula Vista Northeast
- 91915 — Chula Vista Southeast
The statistics are based on San Diego MLS data current as of July 5, 2026. Because some ZIP codes had relatively few monthly transactions, individual percentage changes can appear extreme. Year-to-date figures and rolling price trends should therefore be considered alongside the single-month results.
Executive Summary
The strongest overall message from June is that Chula Vista’s detached-home market remained highly competitive because inventory was limited across all five ZIP codes.
Detached months of supply ranged from only:
- 1.4 months in 91911
- 1.6 months in 91915
- 2.1 months in 91910
- 2.4 months in 91914
- 2.5 months in 91913
Every Chula Vista ZIP code in the reports had less detached inventory than would normally be associated with a balanced market.
Seller leverage was also visible in the percentage of original asking price received. Detached sellers averaged:
- 102.0% in 91911
- 100.8% in 91910
- 99.7% in 91913
- 99.5% in 91915
- 98.9% in 91914
The city’s highest June detached median was in 91914 at $1,260,000, followed by 91913 at $1,132,500 and 91915 at $1,082,500. Western Chula Vista remained more affordable, with June detached medians of $900,000 in 91910 and $794,950 in 91911.
The attached-home market was less uniform. June attached medians ranged from $540,500 in 91911 to $700,000 in 91915. Attached homes sold especially quickly in 91913, 91914 and 91915, while attached properties in 91910 and 91911 took longer than one year earlier.
Chula Vista Detached-Home Comparison
June 2026 Detached Market by ZIP Code
| ZIP code | New listings | Pending sales | Closed sales | Median price | Original price received | Days on market | Homes for sale | Months of supply |
|---|---|---|---|---|---|---|---|---|
| 91910 | 24 | 17 | 17 | $900,000 | 100.8% | 16 | 34 | 2.1 |
| 91911 | 22 | 21 | 18 | $794,950 | 102.0% | 13 | 26 | 1.4 |
| 91913 | 39 | 25 | 26 | $1,132,500 | 99.7% | 30 | 55 | 2.5 |
| 91914 | 10 | 10 | 11 | $1,260,000 | 98.9% | 29 | 17 | 2.4 |
| 91915 | 10 | 9 | 10 | $1,082,500 | 99.5% | 32 | 15 | 1.6 |
Several conclusions stand out.
91914 remained Chula Vista’s highest-priced detached ZIP code, while 91913 generated the largest number of detached sales among the eastern ZIP codes. The tightest detached inventory was found in 91911 and 91915.
The fastest detached sales occurred in western Chula Vista:
- 13 days in 91911.
- 16 days in 91910.
- 29 days in 91914.
- 30 days in 91913.
- 32 days in 91915.
This does not necessarily mean western Chula Vista was universally stronger than eastern Chula Vista. Lower purchase prices can attract a broader pool of buyers, and monthly results depend heavily on the mix and condition of homes sold. Nevertheless, June buyers moved especially quickly in 91910 and 91911.
Chula Vista Attached-Home Comparison
June 2026 Condominium and Townhome Market
| ZIP code | New listings | Pending sales | Closed sales | Median price | Original price received | Days on market | Homes for sale | Months of supply |
|---|---|---|---|---|---|---|---|---|
| 91910 | 6 | 6 | 11 | $637,900 | 100.0% | 31 | 24 | 2.5 |
| 91911 | 25 | 12 | 12 | $540,500 | 99.6% | 32 | 32 | 3.3 |
| 91913 | 23 | 13 | 13 | $663,000 | 100.2% | 25 | 46 | 2.7 |
| 91914 | 2 | 2 | 5 | $660,100 | 98.3% | 27 | 4 | 1.2 |
| 91915 | 20 | 14 | 15 | $700,000 | 99.5% | 27 | 32 | 2.6 |
The attached market remained competitive in eastern Chula Vista. All three eastern ZIP codes had less than three months of attached inventory:
- 91914: 1.2 months.
- 91915: 2.6 months.
- 91913: 2.7 months.
However, 91914’s attached statistics came from a very small number of transactions, so percentage changes should be interpreted with particular caution.
ZIP Code 91910: Chula Vista North
Detached Homes
The 91910 detached market remained highly active in June.
New listings increased from 22 to 24, a gain of 9.1%. Pending sales rose 30.8% from 13 to 17, indicating that buyer demand increased faster than new supply. Closed sales declined slightly from 18 to 17, but year-to-date closings were up 7.2%, from 83 to 89.
The June detached median price was $900,000, down 2.4% from $922,500 in June 2025. The year-to-date median, however, rose 2.2% to $915,000. This contrast illustrates why one month should not be used by itself to declare that property values are falling. The June median may have been influenced by the size, location and condition of the 17 homes that closed.
Competition was strong:
- Sellers received an average of 100.8% of original list price.
- Average market time fell from 25 to only 16 days.
- Inventory declined 19% to 34 homes.
- Months of supply fell from 3.1 to 2.1 months.
A home selling for more than 100% of its original list price, on average, suggests that desirable and accurately priced listings frequently generated strong buyer interest.
91910 detached year-to-date perspective
Through June:
- New listings increased 5.2%.
- Pending sales increased 17.9%.
- Closed sales increased 7.2%.
- Median price increased 2.2%.
- Days on market declined 8%.
The year-to-date numbers support the conclusion that 91910’s detached market remained healthy, with rising contract activity and modest price appreciation.
Attached Homes
The 91910 attached market produced strong price statistics but slower sales.
The June median increased 16% from $550,000 to $637,900. Year to date, the median rose 20% to $660,000.
At the same time:
- New listings fell 50% to six.
- Pending sales were unchanged at six.
- Closed sales declined 15.4% to 11.
- Average days on market increased from 19 to 31 days.
- Inventory was unchanged at 24 homes.
- Supply remained at 2.5 months.
The price increase is significant, but the monthly sample consisted of only 11 closings. It may reflect the type and quality of attached properties sold rather than a uniform 16% increase in every condominium or townhome.
Year-to-date attached closings were down 19.7%, even though new listings increased 16.1%. That combination suggests buyers had become more selective over the first half of the year.
Expert view of 91910
91910 remained one of Chula Vista’s most active and centrally located resale markets. Detached homes were moving quickly and often above asking price. Attached homes still had relatively limited supply, but sellers needed to account for longer market times and differences among individual condominium communities.
ZIP Code 91911: Chula Vista South
Detached Homes
The 91911 detached market was arguably the most intensely competitive Chula Vista segment in June.
Pending sales increased 50%, from 14 to 21, while closed sales rose 5.9% to 18. New listings declined slightly to 22.
The June median price increased 6% from $750,000 to $794,950. Sellers received an average of 102.0% of their original list price, the highest detached percentage among the five ZIP codes.
Homes accepted offers in only 13 days, down from 18 days one year earlier.
Inventory conditions were exceptionally tight:
- Active listings declined 36.6% to 26.
- Supply dropped from 2.7 months to only 1.4 months.
The combination of 50% more pending sales, 36.6% less inventory, offers accepted in 13 days and a 102% sale-to-original-list-price ratio clearly favored sellers.
91911 detached year-to-date perspective
Through June:
- Pending sales increased 27.8%.
- Closed sales increased 25%.
- New listings increased only 5.3%.
- The median was nearly unchanged at $821,250.
- Average market time increased from 28 to 31 days.
The June market was considerably faster than the year-to-date average. That suggests momentum strengthened during the late spring and early summer period.
Attached Homes
The 91911 attached market moved in a different direction.
New listings rose sharply from 11 to 25, an increase of 127.3%. Closed sales increased from five to 12, but pending sales remained unchanged at 12.
Inventory more than doubled from 15 to 32 homes, while months of supply increased from 1.9 to 3.3 months. Days on market rose from nine to 32 days.
The June attached median declined 13.6%, from $625,300 to $540,500. However, only 12 sales closed, and year-to-date median pricing was unchanged at $600,000. Therefore, the June decline appears at least partly related to the mix of units sold.
Expert view of 91911
The 91911 market contained two distinct stories:
- Detached housing was extremely competitive.
- Attached housing gave buyers considerably more selection and negotiating time.
Detached sellers were operating in a low-inventory environment, while condominium sellers faced more competition than they did one year earlier.
ZIP Code 91913: Chula Vista–Eastlake
ZIP code 91913 is one of the most important residential markets in eastern Chula Vista and includes substantial portions of the broader Eastlake and Otay Ranch area. Because the report is ZIP-code based, its statistics should not be treated as subdivision-level results for every individual neighborhood.
Detached Homes
The 91913 detached market had one of Chula Vista’s strongest June sales performances.
Closed sales increased 44.4%, from 18 to 26. Pending sales rose 8.7% to 25, while new listings declined 4.9% to 39.
The June median price jumped 17.7%, from $962,000 to $1,132,500. Sellers received an average of 99.7% of original asking price.
Inventory was nearly unchanged, increasing slightly from 54 to 55 homes. However, because sales activity strengthened, months of supply declined 24.2% from 3.3 to 2.5 months.
Days on market increased from 26 to 30 days, indicating that the market was competitive but not indiscriminate. Buyers remained active, yet some properties required a full marketing period before attracting an acceptable offer.
Interpreting the June price increase
The 17.7% annual increase in June’s median appears dramatic, but the year-to-date median was essentially unchanged:
- First half of 2025: $1,035,075.
- First half of 2026: $1,031,250.
- Change: -0.4%.
That is a crucial distinction. June included a more expensive mix of detached homes than June 2025, but the first-half trend indicates overall detached values in 91913 were broadly stable.
91913 detached year-to-date activity
Through June:
- New listings increased 6.5%.
- Pending sales increased 24.3%.
- Closed sales increased 20%.
- Median price declined 0.4%.
- Days on market increased 7.1%.
Sales activity clearly expanded, even though the year-to-date median remained almost flat. Demand was healthy, but buyers continued to distinguish among individual homes based on condition, location, lot, floor plan and price.
Attached Homes
Attached housing in 91913 experienced tighter supply but fewer transactions.
Compared with June 2025:
- New listings fell 30.3% to 23.
- Pending sales declined 18.8% to 13.
- Closed sales declined 7.1% to 13.
- Inventory fell 29.2% to 46.
- Supply fell from 4.0 to 2.7 months.
The median price rose slightly to $663,000, an increase of 0.5%. Sellers received an average of 100.2% of original price, and days on market dropped sharply from 38 to 25 days.
The attached market therefore had fewer available properties and fewer transactions, but appropriately priced homes sold more quickly and, on average, slightly above their original asking prices.
Year to date, the median rose 1.5% to $660,000. However, year-to-date days on market increased substantially from 40 to 53 days, showing that the first half of 2026 was more challenging than the June figure alone suggests.
Eastlake Market Analysis

Eastlake is not one uniform property market. It includes detached homes, townhomes, condominiums, gated neighborhoods, established subdivisions and newer residential areas. The 91913 report provides the strongest ZIP-level statistical picture of the Eastlake market, while some communities commonly associated with the larger Eastlake area may fall within nearby ZIP codes.
The principal June conclusions for Eastlake were:
Strong detached-home sales
Detached closings increased 44.4% in 91913. That was one of the largest sales gains in Chula Vista.
High but mix-sensitive pricing
The June detached median reached $1,132,500, but the year-to-date median was nearly flat. Homeowners should therefore avoid assuming that all Eastlake properties appreciated by 17.7%. Property-specific comparable sales remain essential.
Reduced attached inventory
Attached inventory fell almost 30%, and months of supply declined to 2.7. This helped well-priced attached properties sell in only 25 days.
Buyers still differentiated among homes
Detached days on market increased to 30, while year-to-date attached market time remained elevated. Buyers were active, but condition and pricing continued to matter.
For Eastlake sellers, the market was favorable but highly dependent on presentation and competitive positioning. For buyers, inventory was limited enough that strong listings could attract quick attention, particularly in communities with desirable floor plans, garages, outdoor space and manageable homeowner association costs.
Otay Ranch Market Analysis
Otay Ranch extends through more than one eastern Chula Vista ZIP code, particularly portions of 91913 and 91915. Because the supplied reports are organized by ZIP code rather than master-planned community boundaries, the Otay Ranch discussion must combine the broader patterns visible in those two areas.
The June data show two different but complementary Otay Ranch trends.
91913: high detached sales volume
In 91913, detached sales increased 44.4% and the June median reached $1,132,500. Pending activity also increased, and sellers received 99.7% of their original asking price.
91915: extremely tight inventory
In 91915, detached supply fell to only 1.6 months, while the June median reached $1,082,500. Attached inventory was also constrained at 2.6 months, and the attached median reached $700,000.
Taken together, the ZIP-level data indicate that Otay Ranch remained a competitive market for both detached and attached homes, although the number of detached transactions in 91915 was lower than one year earlier.
Otay Ranch sellers should recognize that market performance varies by village, age of construction, HOA and community fees, lot size, parking, upgrades and proximity to retail and community amenities. Two homes with similar bedroom counts can perform very differently based on their specific neighborhood and ownership costs.
For buyers, reviewing all recurring monthly costs is essential. In addition to the mortgage, taxes and insurance, buyers should evaluate HOA dues and any additional community assessments that may apply to a specific property.
ZIP Code 91914: Chula Vista Northeast
ZIP code 91914 remained Chula Vista’s highest-priced detached market in June and is associated with several upscale eastern neighborhoods, including the broader Rolling Hills Ranch area.
Detached Homes
The June detached median was $1,260,000, the highest among all five ZIP codes. However, it declined 11.9% from $1,430,000 in June 2025.
The decline should be interpreted cautiously because only 11 detached sales closed during June 2026, compared with 10 one year earlier. A small change in the mix of luxury, view, lot-size or larger-floor-plan transactions can substantially affect the median.
Other conditions were strong:
- Pending sales increased 42.9% to 10.
- Closed sales increased 10% to 11.
- Days on market fell from 36 to 29 days.
- Inventory declined 37% to only 17 homes.
- Months of supply fell from 3.6 to 2.4 months.
Sellers received 98.9% of original asking price. Although that was below the other eastern ZIP codes, it still indicates that sales generally occurred relatively close to asking price.
91914 detached year-to-date perspective
Through June:
- New listings increased 4.2%.
- Pending sales increased 12.2%.
- Closed sales declined 12.2%.
- Median price declined 1.9% to $1,295,000.
- Days on market fell 32.5%, from 40 to 27.
The year-to-date price decline was modest, particularly compared with June’s 11.9% monthly decline. The broader trend therefore appears considerably more stable than one month’s number suggests.
Attached Homes
Only two attached listings and two pending sales were recorded during June, while five transactions closed. Because no attached sales closed in June 2025, a meaningful monthly percentage comparison was unavailable.
The June median was $660,100. Inventory consisted of only four homes, representing 1.2 months of supply.
Year to date:
- Closed sales increased from 11 to 19.
- Median price increased 6.2% to $690,000.
- Sellers received an average of 100% of original price.
- Days on market declined from 45 to 30.
The attached segment was small but competitive.
Rolling Hills Ranch Market Analysis
Rolling Hills Ranch is best evaluated through the broader 91914 data, while recognizing that ZIP-level figures include other neighborhoods as well.
June’s 91914 detached statistics suggest the following conditions for Rolling Hills Ranch and nearby upscale communities:
Limited competition among sellers
Only 17 detached homes were active throughout the ZIP code at the end of June. Inventory was down 37% from one year earlier.
Strong buyer engagement
Pending sales increased 42.9%, and homes accepted offers in an average of 29 days.
High price point
The ZIP’s $1.26 million detached median was the highest in Chula Vista.
Monthly price comparisons require caution
The 11.9% decline in June’s median does not necessarily signal an equivalent decline in individual property values. Year-to-date pricing was down only 1.9%, and the monthly result was based on 11 transactions.
For Rolling Hills Ranch sellers, the shortage of competing inventory was a favorable factor. However, buyers at this price point often compare condition, views, lot utility, interior upgrades and floor plans carefully. A low-inventory market does not eliminate the need for precise pricing.
ZIP Code 91915: Chula Vista Southeast
ZIP code 91915 includes major portions of eastern Chula Vista and is particularly relevant to the Windingwalk and Otay Ranch markets.
Detached Homes
The 91915 detached market experienced fewer listings and fewer sales, but substantially higher monthly pricing.
Compared with June 2025:
- New listings declined 37.5% to 10.
- Pending sales declined 35.7% to nine.
- Closed sales declined 47.4% to 10.
- Inventory declined 34.8% to only 15 homes.
- Supply fell from 2.1 to 1.6 months.
The median price increased 19.2% from $908,000 to $1,082,500. Sellers received an average of 99.5% of original asking price, while homes took 32 days to receive an accepted offer.
The 19.2% monthly median increase was much larger than the year-to-date increase of 6.9%. That suggests June’s closed-sale mix included a greater share of higher-priced detached homes.
91915 detached year-to-date perspective
Through June:
- New listings declined 21.6%.
- Pending sales declined 16.4%.
- Closed sales declined 6.9%.
- Median price increased 6.9% to $982,500.
- Days on market declined 14.3% to 24.
- Sellers received 100.2% of original price.
The market had fewer transactions but strong price support and faster sales. This is a classic low-supply pattern: declining volume does not necessarily indicate declining demand when the number of available homes also contracts sharply.
Attached Homes
The attached market in 91915 was very active during June.
- New listings increased 17.6% to 20.
- Pending sales increased 75% to 14.
- Closed sales increased 50% to 15.
- Median price increased 11.6% to $700,000.
- Days on market fell from 35 to 27 days.
- Inventory declined 5.9% to 32 homes.
- Supply declined to 2.6 months.
Sellers received an average of 99.5% of original asking price.
Year-to-date attached pricing was less dramatic. The median declined 2.1% to $690,000, even though closed sales rose 6.6%. June was therefore a particularly strong month, but the broader first-half price trend remained relatively stable.
Windingwalk Market Analysis
Windingwalk is most closely reflected in the broader 91915 statistics, although the ZIP-level report also includes other communities.
June conditions were favorable for Windingwalk-area sellers:
- Detached supply was only 1.6 months.
- Attached supply was 2.6 months.
- Detached sellers received 99.5% of asking price.
- Attached sellers also received 99.5%.
- Attached pending sales increased 75%.
- Attached homes took an average of 27 days to secure an offer.
The large gain in attached pending sales is particularly relevant because Windingwalk includes a meaningful mix of townhome and condominium-style housing. The data suggest strong buyer demand for attached properties in the broader 91915 market.
However, buyers will continue to compare total monthly ownership costs. HOA dues, community assessments, insurance, parking arrangements and unit condition may have a substantial effect on marketability and value.
For detached homes, the shortage of listings favored sellers, but the decline in total sales also indicates that buyers had fewer opportunities to purchase. A well-positioned home could attract strong attention, while an overpriced property could still sit because buyers were carefully evaluating monthly payments.
How the Eastern Chula Vista Markets Compare
Detached Housing
| Area represented by ZIP data | ZIP | June median | Closed-sale change | Inventory change | Months of supply |
|---|---|---|---|---|---|
| Eastlake/Otay Ranch area | 91913 | $1,132,500 | +44.4% | +1.9% | 2.5 |
| Rolling Hills Ranch/NE Chula Vista | 91914 | $1,260,000 | +10.0% | -37.0% | 2.4 |
| Windingwalk/Otay Ranch area | 91915 | $1,082,500 | -47.4% | -34.8% | 1.6 |
The strongest sales-volume growth occurred in 91913. The highest price point was in 91914. The tightest inventory was in 91915.
Attached Housing
| Area represented by ZIP data | ZIP | June median | Closed-sale change | Inventory change | Months of supply |
|---|---|---|---|---|---|
| Eastlake/Otay Ranch area | 91913 | $663,000 | -7.1% | -29.2% | 2.7 |
| NE Chula Vista | 91914 | $660,100 | Not comparable | -60.0% | 1.2 |
| Windingwalk/Otay Ranch area | 91915 | $700,000 | +50.0% | -5.9% | 2.6 |
The attached market was especially active in 91915, while 91913 experienced fewer sales but much lower inventory and faster marketing times.
What June’s Market Means for Chula Vista Sellers
Detached-home sellers
Detached sellers were generally in a favorable position throughout Chula Vista.
Every ZIP code had less than 2.5 months of inventory, and four of the five ZIP codes had at least a one-third year-over-year reduction in inventory or a supply near two months.
The strongest seller conditions were visible in:
- 91911, with 1.4 months of supply and 102% of asking price received.
- 91915, with 1.6 months of supply.
- 91910, with offers accepted in 16 days and 100.8% received.
- 91913, with a 44.4% increase in June closings.
- 91914, with a 37% decline in active inventory.
Nevertheless, sellers should not assume that any asking price will succeed. Buyers remain sensitive to monthly payments and compare properties carefully.
A strong listing strategy should include:
- Pricing based on current neighborhood sales rather than countywide averages.
- Professional photography.
- Strong online presentation.
- Careful preparation before going active.
- Complete and accurate disclosures.
- A review of competing listings.
- A plan for the first seven to ten days on the market.
- Early evaluation of showing activity and buyer feedback.
Attached-home sellers
Condominium and townhome sellers need a more property-specific strategy.
Attached markets in 91913, 91914 and 91915 had low inventory, but the overall performance depended on HOA costs, property condition and community characteristics.
In 91911, inventory increased substantially, giving buyers more alternatives. In 91910, prices were strong but market time increased.
Attached sellers should prepare HOA documents early and understand how monthly dues, reserves, assessments, insurance and financing eligibility may affect buyer demand.
What June’s Market Means for Chula Vista Buyers
Buyers seeking detached homes
Detached buyers should be prepared for limited selection and competition for well-priced listings.
The most competitive conditions were not limited to higher-priced eastern Chula Vista. Homes in 91910 and 91911 sold faster and, on average, at or above their original prices.
Buyers should:
- Obtain full loan preapproval.
- Review estimated property taxes and insurance.
- Include HOA and community fees when applicable.
- Evaluate comparable sales before writing.
- Read disclosures promptly.
- Identify material concerns separately from cosmetic issues.
- Avoid assuming that every home will sell below asking price.
Buyers seeking attached homes
Attached buyers had more options in certain ZIP codes, particularly 91911. However, eastern Chula Vista attached inventory remained relatively constrained.
The attached median ranged from $540,500 to $700,000, offering a lower entry point than detached housing but also introducing HOA-related considerations.
Buyers should investigate:
- Monthly HOA dues.
- Special assessments.
- Association reserves.
- Master insurance coverage.
- Pending litigation.
- Rental restrictions.
- Parking arrangements.
- VA or FHA project eligibility when applicable.
- Maintenance obligations.
- Community assessments and other recurring charges.
Was Chula Vista a Buyer’s or Seller’s Market in June 2026?
Detached market
The detached market clearly favored sellers across all five ZIP codes.
Supply levels between 1.4 and 2.5 months, rapid sales and high original-list-price percentages all point to seller-favored conditions.
Attached market
The attached market ranged from seller-favored to more balanced.
- 91914 was extremely limited, but based on few transactions.
- 91910, 91913 and 91915 remained relatively tight.
- 91911 had 3.3 months of supply and a large increase in inventory, giving buyers more leverage.
It would therefore be inaccurate to label every Chula Vista property a strong seller’s-market listing. Market position depended on ZIP code, property type, community, condition and price range.
Chula Vista Market Outlook for the Second Half of 2026
Several themes are likely to shape the coming months.
Inventory remains the most important factor
Detached inventory was low throughout the city. Unless new listings increase substantially, buyers will continue to compete for the best properties.
Eastern Chula Vista should remain price-sensitive
Eastlake, Otay Ranch, Windingwalk and Rolling Hills Ranch continue to command premium prices, but affordability limits how aggressively buyers can stretch. Homes that are overpriced relative to recent sales may still experience longer market times.
Attached demand may remain strong
The attached sector provides a more attainable alternative to detached housing. June’s sharp increase in attached pending and closed sales in 91915 illustrates that demand remains substantial where buyers perceive good value.
Monthly price swings should be interpreted carefully
ZIP-level monthly samples can be small. The 19.2% detached increase in 91915, the 17.7% increase in 91913 and the 11.9% decline in 91914 do not necessarily indicate equivalent changes in the value of every home.
Year-to-date medians provide a more stable view:
| ZIP | Detached YTD median change | Attached YTD median change |
|---|---|---|
| 91910 | +2.2% | +20.0% |
| 91911 | -0.2% | 0.0% |
| 91913 | -0.4% | +1.5% |
| 91914 | -1.9% | +6.2% |
| 91915 | +6.9% | -2.1% |
These figures show that most detached year-to-date changes were relatively moderate, with 91915 producing the strongest increase.
Final Chula Vista Market Analysis
The June 2026 Chula Vista housing market was defined by tight detached inventory, active buyer demand and sharp differences among ZIP codes and property types.
The western market demonstrated exceptional speed. Detached homes in 91910 and 91911 took only 16 and 13 days, respectively, to receive accepted offers. Sellers in those ZIP codes averaged above 100% of their original asking prices.
Eastern Chula Vista remained the city’s premium market:
- 91914 had the highest detached median at $1.26 million.
- 91913 recorded a 44.4% increase in detached closings.
- 91915 had only 1.6 months of detached inventory and a strong attached-sales increase.
For the named communities:
- Eastlake was supported by strong detached activity and reduced attached inventory in 91913.
- Otay Ranch showed active demand across the broader 91913 and 91915 markets.
- Windingwalk benefited from the strong attached activity and limited inventory visible in 91915.
- Rolling Hills Ranch operated within a high-price, low-inventory 91914 environment.
The market favored sellers overall, but success still depended on local expertise. Chula Vista contains mature western neighborhoods, luxury and view-oriented eastern communities, master-planned developments, townhomes, condominiums and newer detached housing. Each segment responds differently to pricing, financing costs, HOA fees, condition and competing inventory.
For sellers, the opportunity is real, particularly in the detached market. For buyers, preparation and a clear understanding of value are essential. The most desirable and accurately priced homes may move quickly, but overpriced or poorly prepared properties can still create negotiating opportunities.
This report is based on June 2026 San Diego MLS data for Chula Vista ZIP codes 91910, 91911, 91913, 91914 and 91915, current as of July 5, 2026. Median prices and original-list-price percentages do not account for seller concessions or down-payment assistance. Community commentary is based on the broader ZIP-code statistics and should not be interpreted as subdivision-specific sales data.