Rancho Peñasquitos Real Estate Market Update Fall 2025
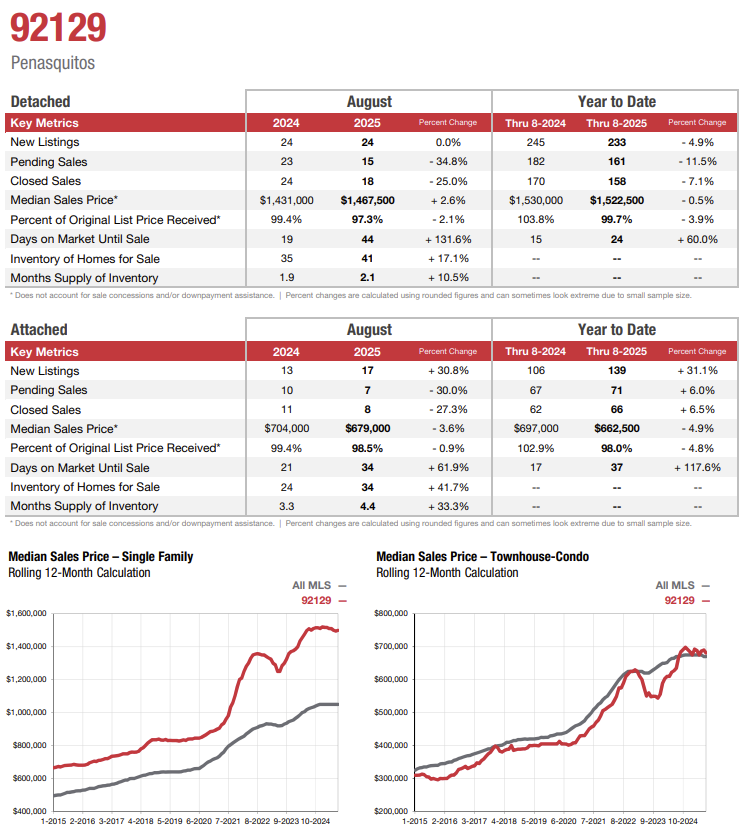
Detached Homes in Rancho Penasquitos New Listings, Pending Sales, Closed Sales, Median Sales Price All Down Year to Date
Current as of September 5, 2025. Data: Greater San Diego Association of REALTORS® Local Market Update (San Diego MLS).

Quick Takeaways
-
Detached homes in Rancho Penasquitos (single-family): Prices are essentially holding year-over-year while demand cooled and marketing times doubled. Inventory edged up, but supply remains lean at just ~2.1 months, so quality listings still move when priced correctly.
-
Attached homes in Rancho Penasquitos (townhome/condo): More choices, slower pace, softer pricing. Inventory and months’ supply climbed sharply to ~4.4 months, and days on market lengthened, giving buyers room to negotiate. This is similar to most areas in North County Inland San Diego.
Note: Median prices and % of list received do not account for concessions and/or down-payment assistance. Percent changes use rounded figures.
Detached Homes (Single-Family)
August 2025 vs. August 2024
-
New Listings: 24 → 24 (0.0%)
-
Pending Sales: 23 → 15 (-34.8%)
-
Closed Sales: 24 → 18 (-25.0%)
-
Median Sales Price: $1,431,000 → $1,467,500 (+2.6%)
-
% of Original List Price Received: 99.4% → 97.3% (-2.1%)
-
Days on Market (median): 19 → 44 (+131.6%)
-
Active Inventory: 35 → 41 (+17.1%)
-
Months’ Supply: 1.9 → 2.1 (+10.5%).
What it means: Pricing remains resilient even as buyer urgency eased (pendings/closings down, DOM up). With supply still just a little over two months, clean, well-priced homes continue to attract offers—just not at the frenzied pace of prior years.
Year-to-Date (through August)
-
New Listings: 245 → 233 (-4.9%)
-
Pending Sales: 182 → 161 (-11.5%)
-
Closed Sales: 170 → 158 (-7.1%)
-
Median Sales Price: $1,530,000 → $1,522,500 (-0.5%)
-
% of Original List Price Received: 103.8% → 99.7% (-3.9%)
-
Days on Market (median): 15 → 24 (+60.0%).
Read on this: Over-ask bidding has normalized (99.7% of original list YTD vs 103.8% last year). Sellers should expect more days on market and build in room for minor credits or appraisal/inspection negotiations.
Attached Homes (Townhomes & Condos)
August 2025 vs. August 2024
-
New Listings: 13 → 17 (+30.8%)
-
Pending Sales: 10 → 7 (-30.0%)
-
Closed Sales: 11 → 8 (-27.3%)
-
Median Sales Price: $704,000 → $679,000 (-3.6%)
-
% of Original List Price Received: 99.4% → 98.5% (-0.9%)
-
Days on Market (median): 21 → 34 (+61.9%)
-
Active Inventory: 24 → 34 (+41.7%)
-
Months’ Supply: 3.3 → 4.4 (+33.3%).
What it means: Buyers now have significantly more selection and time. With months’ supply near the balanced range and DOM stretching, attached-segment pricing is more negotiable than a year ago.
Year-to-Date (through August)
-
New Listings: 106 → 139 (+31.1%)
-
Pending Sales: 67 → 71 (+6.0%)
-
Closed Sales: 62 → 66 (+6.5%)
-
Median Sales Price: $697,000 → $662,500 (-4.9%)
-
% of Original List Price Received: 102.9% → 98.0% (-4.8%)
-
Days on Market (median): 17 → 37 (+117.6%).
Read on this: Even with more closings YTD in Rancho Penasquitos, extra supply has pulled prices back and widened negotiation bands. Expect attached sellers to offer credits, rate buydowns, or list-price adjustments to compete.
How to Use These Trends
For Sellers
-
Price to today’s comps in Rancho Penasquitos, not last spring’s headlines. Over-ask outcomes have faded; most accepted offers land near—but often below—list after inspections.
-
Invest in presentation. With DOM up across both segments, homes that feel turnkey (paint, flooring, lighting, landscaping) still command the strongest traffic and best terms.
-
Plan for negotiation. Build in contingencies for credit requests or minor repairs, especially in the attached segment with ~4.4 months of supply.
For Buyers
-
Detached: Still competitive for the best houses, but the tempo is calmer. Use longer DOM and slightly higher inventory to negotiate repairs, credits, or timing.
-
Attached: Conditions are buyer-tilted in Rancho Penasquitos. With more choices and longer DOM, ask for rate buydowns, closing-cost credits, or price improvements—and take the time to compare HOA dues, amenities, and reserves.
Longer-Term Context
Rolling 12-month charts in the report show the multi-year climb in 92129 values since 2015, followed by today’s post-pandemic normalization: slower absorption, more inventory, and fewer over-ask outcomes. Use that lens when setting expectations for both price and timing in late 2025.
Methodology & Notes
-
Figures reflect August 2025 monthly results and Year-to-Date through August comparisons vs. the same periods in 2024.
-
Medians and “% of original list received” exclude concessions; percent changes use rounded figures and can look large when sample sizes are small.
-
Source: San Diego MLS; Local Market Update prepared for GSDAR; © 2025 ShowingTime Plus, LLC.