Oceanside South Real Estate Market Update Fall 2025
Buyer Urgency Cools Off but Prices Still Inch Up
Current as of September 5, 2025. Data: Greater San Diego Association of REALTORS® Local Market Update (San Diego MLS).92054 Oceanside South in North County Coastal San Diego
Fast Take
-
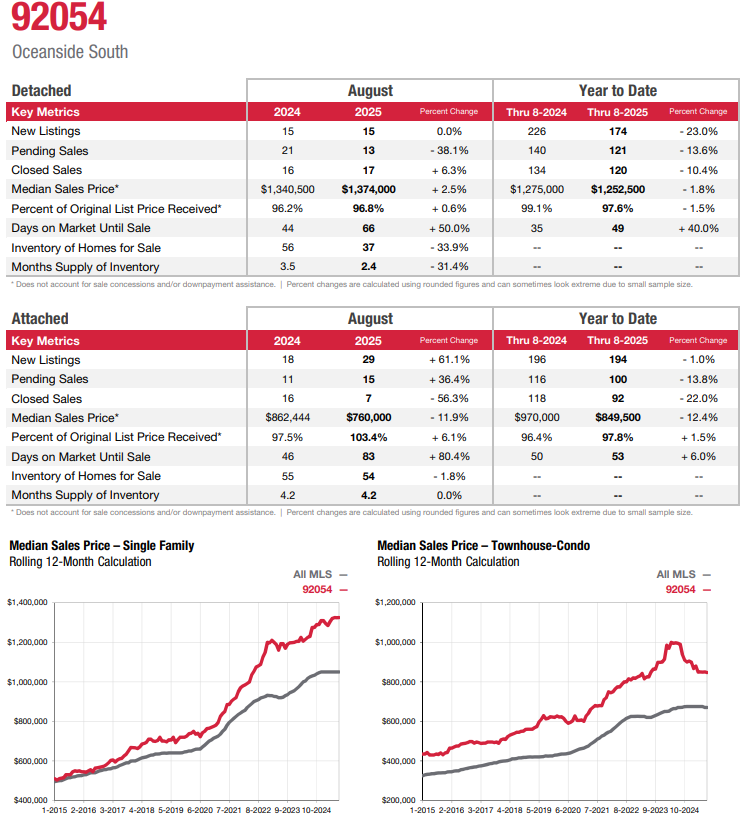
Detached (single-family homes in Oceanside 92054): Prices inched up year over year for August, even as buyer urgency cooled (pendings down, DOM higher). Inventory fell and months’ supply tightened to ~2.4, keeping leverage tilted toward well-prepared sellers.
-
Attached (townhome/condoin Oceanside 92054): Mixed signals—more new listings and pendings in August, but closings slowed and prices were softer month-over-month and notably lower YTD. Months’ supply held around ~4.2, a near-balanced/buyer-leaning setup.
Note: Median prices and % of list received exclude concessions. Small sample sizes in 92054 can make % changes look extreme.

Detached Homes (Single-Family)
August 2025 vs. August 2024
-
New Listings: 15 → 15 (0.0%)
-
Pending Sales: 21 → 13 (-38.1%)
-
Closed Sales: 16 → 17 (+6.3%)
-
Median Sales Price: $1,340,500 → $1,374,000 (+2.5%)
-
% of Original List Price Received: 96.2% → 96.8% (+0.6%)
-
Days on Market (median): 44 → 66 (+50.0%)
-
Active Inventory: 56 → 37 (-33.9%)
-
Months’ Supply: 3.5 → 2.4 (-31.4%).
Read on this: Despite slower buyer action (fewer pendings, longer DOM), tight supply and a slight price gain suggest the best-presented homes still command attention. Sellers have leverage, but it’s conditional on pricing and condition.
Year-to-Date (through August)
-
New Listings: 226 → 174 (-23.0%)
-
Pending Sales: 140 → 121 (-13.6%)
-
Closed Sales: 134 → 120 (-10.4%)
-
Median Sales Price: $1,275,000 → $1,252,500 (-1.8%)
-
% of Original List Price Received: 99.1% → 97.6% (-1.5%)
-
Days on Market (median): 35 → 49 (+40.0%).
What it means for SFR: The YTD story is fewer listings, slower absorption, and slightly lower pricing—classic normalization from the pandemic run-up. Expect more days on market and tighter appraisal/inspection negotiations than last year.
Attached Homes (Townhomes & Condos)
August 2025 vs. August 2024
-
New Listings: 18 → 29 (+61.1%)
-
Pending Sales: 11 → 15 (+36.4%)
-
Closed Sales: 16 → 7 (-56.3%)
-
Median Sales Price: $862,444 → $760,000 (-11.9%)
-
% of Original List Price Received: 97.5% → 103.4% (+6.1%)
-
Days on Market (median): 46 → 83 (+80.4%)
-
Active Inventory: 55 → 54 (-1.8%)
-
Months’ Supply: 4.2 → 4.2 (flat).
Read on this: August brought more options and more accepted offers, but many of those will close later, so closings lagged. Pricing softened on the month, though the % of list >100% hints that the best-located or turnkey units can still see competition.
Year-to-Date (through August)
-
New Listings: 196 → 194 (-1.0%)
-
Pending Sales: 116 → 100 (-13.8%)
-
Closed Sales: 118 → 92 (-22.0%)
-
Median Sales Price: $970,000 → $849,500 (-12.4%)
-
% of Original List Price Received: 96.4% → 97.8% (+1.5%)
-
Days on Market (median): 50 → 53 (+6.0%).
What it means for condos/THs: The YTD picture is demand down and prices retracing from 2024 highs. With ~4.2 months of supply and longer DOM, buyers have time and leverage; sellers succeed by pricing to the market and offering value (condition, credits, or rate buydowns).
Strategy Playbook
If You’re Selling You're Home in Oceanside
-
Price to today’s comps. Over-ask outcomes are rarer; accepted offers cluster near list—sometimes below—after inspections. Build in negotiation room.
-
Win on presentation. With DOM up across both segments (to 66 days for SFR and 83 days for attached in August), turnkey condition (paint, flooring, lighting, landscaping) can be the difference between watching and selling.
-
Use concessions strategically. Consider closing-cost credits or rate buydowns—especially for attached listings near the balanced range (~4.2 months).
If You’re Buying a Home in Oceanside
-
Detached: Inventory is thinner (months’ supply ~2.4), so clean, well-priced homes can still draw multiple offers. Leverage longer DOM to negotiate timing, repairs, or small credits—but move decisively on quality.
-
Attached: Take advantage of more choice, more time, and softer YTD pricing. Compare HOA dues/amenities/reserves and request rate buydowns or seller credits to improve total monthly cost.
Longer-Term Context
Rolling 12-month charts in the report show the multi-year rise in both segments through 2021–2023, followed by 2024–2025 normalization: slower absorption, fewer over-ask outcomes, and greater sensitivity to price and condition—especially in the attached market. Use that lens when setting expectations for pricing and timeline this fall.
Methodology & Notes
Figures reflect August 2025 results versus August 2024, and Year-to-Date (through August) versus the same 2024 period. Medians and % of original list price exclude concessions; small counts can amplify percent swings. Source: San Diego MLS; Local Market Update for 92054 – Oceanside South; © 2025 ShowingTime Plus, LLC.