


East Chula Vista Real Estate Market Fall 2025
Including EastLake & Otay Ranch 91913, 91914, 91915
Below is a clear, data-driven read on what actually happened in August 2025 and year-to-date (through August) across EastLake and adjacent Otay Ranch Rolling Hills Ranch. All figures come straight from the San Diego MLS monthly update.

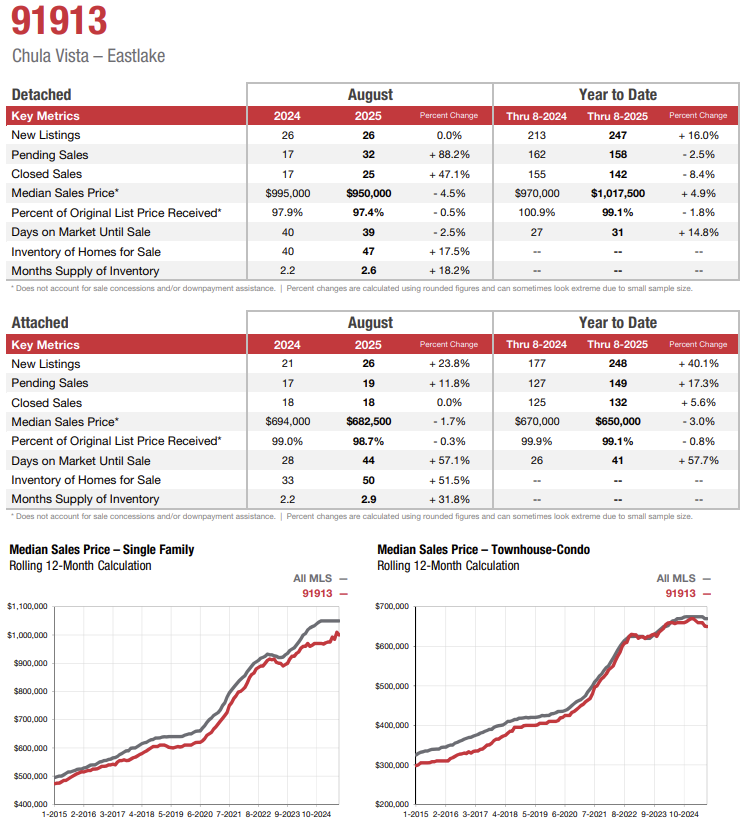
91913 — Chula Vista (EastLake)
Single-Family (Detached)
August 2025 vs. August 2024
-
New listings: 26 → 26 (flat)
-
Pending sales: 17 → 32 (+88.2%)
-
Closed sales: 17 → 25 (+47.1%)
-
Median sales price: $995,000 → $950,000 (–4.5%)
-
% of original list received: 97.9% → 97.4% (–0.5 pp)
-
Days on market (DOM): 40 → 39 (slightly faster)
-
Active inventory: 40 → 47 (+17.5%)
-
Months’ supply: 2.2 → 2.6 (+18.2%)
Year-to-Date (Jan–Aug)
-
New listings: 213 → 247 (+16.0%)
-
Pendings: 162 → 158 (–2.5%)
-
Closings: 155 → 142 (–8.4%)
-
Median price: $970,000 → $1,017,500 (+4.9%)
-
% of original list received: 100.9% → 99.1% (–1.8 pp)
-
DOM: 27 → 31 (+14.8%; slower)
August popped in activity (pendings/closings) as sellers added modestly more inventory and buyers jumped on opportunities—likely helped by negotiability (down from 100.9% YTD last year to 99.1% this year) and slightly longer DOM. YTD prices are still up ~5% even with August’s month-over-month dip.
Townhome/Condo (Attached)
August 2025 vs. August 2024
-
New listings: 21 → 26 (+23.8%)
-
Pendings: 17 → 19 (+11.8%)
-
Closings: 18 → 18 (flat)
-
Median price: $694,000 → $682,500 (–1.7%)
-
% of original list received: 99.0% → 98.7% (–0.3 pp)
-
DOM: 28 → 44 (+57.1%)
-
Inventory: 33 → 50 (+51.5%)
-
Months’ supply: 2.2 → 2.9 (+31.8%)
Year-to-Date (Jan–Aug)
-
New listings: 177 → 248 (+40.1%)
-
Pendings: 127 → 149 (+17.3%)
-
Closings: 125 → 132 (+5.6%)
-
Median price: $670,000 → $650,000 (–3.0%)
-
DOM: 26 → 41 (+57.7%)
Attached inventory expanded sharply, giving buyers more selection. Demand kept up enough to lift pendings, but marketing times lengthened and pricing softened a touch.
91914 — Chula Vista NE (Rolling Hills Ranch & surrounds)
Single-Family (Detached)
August 2025 vs. August 2024
-
New listings: 9 → 9 (flat)
-
Pendings: 13 → 9 (–30.8%)
-
Closings: 11 → 8 (–27.3%)
-
Median price: $1,375,000 → $1,455,000 (+5.8%)
-
% of original list received: 96.9% → 97.4% (+0.5 pp)
-
DOM: 18 → 50 (+177.8%)
-
Inventory: 16 → 23 (+43.8%)
-
Months’ supply: 2.0 → 3.2 (+60.0%)
Year-to-Date (Jan–Aug)
-
New listings: 113 → 96 (–15.0%)
-
Pendings: 77 → 62 (–19.5%)
-
Closings: 69 → 57 (–17.4%)
-
Median price: $1,335,000 → $1,320,135 (–1.1%)
-
% of original list received: 99.7% → 97.6% (–2.1 pp)
-
DOM: 31 → 40 (+29.0%)
Fewer buyers and more selection pushed DOM up notably. Still, August’s median price rose ~6% year-over-year, showing that well-positioned homes at the higher end are finding their market. The move from ~2 to ~3.2 months’ supply suggests a shift toward a more balanced feel, but not a true buyer’s market.
Townhome/Condo (Attached)
August 2025 vs. August 2024
-
New listings: 5 → 2 (–60.0%)
-
Pendings: 3 → 3 (flat)
-
Closings: 5 → 7 (+40.0%)
-
Median price: $610,000 → $665,000 (+9.0%)
-
% of original list received: 102.9% → 98.8% (–4.0 pp)
-
DOM: 20 → 38 (+90.0%)
-
Inventory: 7 → 4 (–42.9%)
-
Months’ supply: 2.9 → 1.2 (–58.6%)
Year-to-Date (Jan–Aug)
-
New listings: 31 → 30 (–3.2%)
-
Pendings: 23 → 24 (+4.3%)
-
Closings: 22 → 20 (–9.1%)
-
Median price: $672,500 → $655,500 (–2.5%)
-
DOM: 20 → 40 (+100%)
Very limited new supply in August tightened conditions, supporting a ~9% price gain month-over-year even as marketing times lengthened.
91915 — Chula Vista SE (Otay Ranch / Montecito)
Single-Family (Detached)
August 2025 vs. August 2024
-
New listings: 9 → 9 (flat)
-
Pendings: 8 → 14 (+75.0%)
-
Closings: 17 → 8 (–52.9%)
-
Median price: $975,000 → $959,606 (–1.6%)
-
% of original list received: 99.5% → 97.4% (–2.1 pp)
-
DOM: 33 → 39 (+18.2%)
-
Inventory: 17 → 20 (+17.6%)
-
Months’ supply: 1.8 → 1.9 (+5.6%)
Year-to-Date (Jan–Aug)
-
New listings: 109 → 129 (+18.3%)
-
Pendings: 83 → 89 (+7.2%)
-
Closings: 80 → 78 (–2.5%)
-
Median price: $965,250 → $918,750 (–4.8%)
-
DOM: 26 → 31 (+19.2%)
Demand improved in August (pendings up) with only a mild increase in supply. YTD median pricing has eased ~5%, suggesting buyers are price-sensitive and responding to homes that show value.
Townhome/Condo (Attached)
August 2025 vs. August 2024
-
New listings: 8 → 21 (+162.5%)
-
Pendings: 12 → 17 (+41.7%)
-
Closings: 20 → 17 (–15.0%)
-
Median price: $725,000 → $720,000 (–0.7%)
-
% of original list received: 99.7% → 100.0% (+0.3 pp)
-
DOM: 28 → 60 (+114.3%)
-
Inventory: 14 → 36 (+157.1%)
-
Months’ supply: 1.1 → 3.4 (+209.1%)
Year-to-Date (Jan–Aug)
-
New listings: 134 → 141 (+5.2%)
-
Pendings: 110 → 93 (–15.5%)
-
Closings: 108 → 86 (–20.4%)
-
Median price: $700,000 → $707,000 (+1.0%)
-
DOM: 32 → 48 (+50.0%)
A surge of new attached listings expanded months’ supply to ~3.4, shifting leverage toward buyers and stretching DOM. Prices held roughly flat month-over-year and are slightly up ~1% YTD, indicating sellers can still achieve solid results with the right strategy.
What This Means for EastLake/Otay Ranch Sellers & Buyers
Sellers
-
Price to the market, not above it. In all three zips, buyers are rewarding homes that show value; the % of original list received has eased from pandemic highs, and DOM is longer in multiple segments.
-
Preparation and presentation matter. With months’ supply hovering ~2–3.5 in many slices, you’re competing with more options. Pre-market prep, strategic pricing, and full-funnel marketing are critical to protect days on market and negotiation power.
-
Detached strength in 91913. Despite August’s monthly price dip, YTD median is up ~5%. Good opportunity for move-up sellers who can pair a strong sale with negotiating power on the buy side.
Buyers
-
More choice, more time (especially attached). 91913 attached and 91915 attached saw sizeable inventory growth and higher months’ supply. This creates room to negotiate on terms, credits, and repairs.
-
Watch micromarkets. 91914 detached had slower absorption but higher August median; premium, turnkey homes can still command strong outcomes even as overall DOM rises.
-
Leverage DOM trends. When DOM stretches beyond ~30–40 days, consider targeted offers with appraisal/repair credits instead of straight price cuts, depending on seller priorities.
Quick Zip-by-Zip Takeaways
-
91913 (EastLake)
-
Detached: Demand rebounded in August; YTD prices +4.9% with modestly higher inventory.
-
Attached: Big supply increase; DOM up; prices –3.0% YTD → better negotiating window.
-
-
91914 (NE Chula Vista / Rolling Hills Ranch)
-
Detached: Buyers are pickier; DOM up; August median +5.8% shows quality still wins.
-
Attached: Low August supply lifted prices +9% YoY; but YTD price slightly lower and DOM higher.
-
-
91915 (SE Chula Vista / Otay Ranch–Montecito)
-
Detached: Activity improving, pricing slightly softer YTD; strategy over sizzle.
-
Attached: Inventory surge → 3.4 months’ supply and much longer DOM; buyers have leverage.
-
Bottom Line
This part of East Chula Vista is transitioning from the ultra-tight, over-asking era to a more balanced, strategy-driven market. Inventory is no longer scarce in several segments, and days on market are normalizing. If you’re selling, price right and present flawlessly. If you’re buying, use the added selection and time to secure favorable terms—especially in the attached segments.
Prepared with MLS data current as of Sept 5, 2025 (Greater San Diego Association of REALTORS® / ShowingTime Plus).
:format(webp):quality(80)/u.realgeeks.media/dawnsellssandiego/Google_Preferred_Source_San_Diego_Real_Estate_Agent.png)