91977 Spring Valley Real Estate Market Update Fall 2025
Spring Valley in East County San Diego California Update
If you’re tracking the Spring Valley (91977), East County San Diego Real Estate market, August delivered a clear message: demand stayed steady, pricing inched up, and pace varied by property type. Below is a data-driven breakdown (Detached vs. Attached) plus what it means for sellers and buyers through the first eight months of 2025.

Key Takeaways at a Glance
-
Detached homes in Spring Valley: Median price up +1.8% YoY in August ($783,000 vs. $769,000), with months of inventory down to 2.3 (tighter supply) and days on market ~26 (slightly faster than last year). Contracts and closings were softer month-over-month, but pricing held.
-
Attached homes in Spring Valley (condos/townhomes): The headline +31.3% YoY jump in the August median ($755,000 vs. $575,000) reflects a very small monthly sample and a shift in mix; year-to-date median is actually down −4.4% ($559,250 vs. $585,000). Inventory rose to 4.1 months (more selection) while days on market fell to 13 in August (the right listings are moving fast).
Note: Medians don’t include concessions; percentage changes use rounded figures and can look dramatic when samples are small, especially for attached homes on a single month. Always pair August snapshots with year-to-date context.
Detached Homes — 91977 (August & YTD)
August 2025 vs. August 2024
-
New Listings: 45 → 45 (0.0%)
-
Pending Sales: 30 → 28 (−6.7%)
-
Closed Sales: 29 → 21 (−27.6%)
-
Median Sales Price: $783,000 → from $769,000 (+1.8%)
-
% of Original List Price (OLP) Received: 100.1% → from 100.9% (−0.8%)
-
Days on Market: 26 → from 27 (−3.7%)
-
Inventory: 65 (down from 68, −4.4%)
-
Months of Supply: 2.3 (down from 2.6, −11.5%)
Year-to-Date (through August 2025 vs. 2024)
-
New Listings: 340 (+2.4%)
-
Pendings: 226 (−0.4%)
-
Closings: 205 (−2.8%)
-
Median Sales Price: $795,000 (+3.1%)
-
% of OLP Received: 99.6% (from 100.8%, −1.2%)
-
Days on Market: 33 (from 26, +26.9%)
What it means:
Detached pricing has crept higher on both a monthly and YTD basis, even with slightly fewer closings and a modest dip in list-price attainment. Lean supply (2.3 months) continues to provide a floor under prices, while buyers face less selection but also more time to evaluate than during the 2021–2022 rush.
Attached Homes — 91977 (August & YTD)
August 2025 vs. August 2024
-
New Listings: 13 → 15 (+15.4%)
-
Pending Sales: 7 → 5 (−28.6%)
-
Closed Sales: 9 → 4 (−55.6%)
-
Median Sales Price: $755,000 → from $575,000 (+31.3%)
-
% of OLP Received: 100.6% (up from 99.5%)
-
Days on Market: 13 (from 32, −59.4%)
-
Inventory: 27 (from 18, +50.0%)
-
Months of Supply: 4.1 (from 2.4, +70.8%)
Year-to-Date (through August 2025 vs. 2024)
-
New Listings: 101 (+11.0%)
-
Pendings: 52 (−17.5%)
-
Closings: 54 (−18.2%)
-
Median Sales Price: $559,250 (−4.4%)
-
% of OLP Received: 99.2% (from 101.0%, −1.8%)
-
Days on Market: 33 (from 28, +17.9%)
What it means:
The August median spike is driven by tiny sample size and mix (e.g., larger or upgraded units closing in a single month). The YTD picture is more telling: volumes are down, pricing is slightly lower, and supply has loosened versus a year ago. Still, when a condo is priced-right and prepped-right, it can move quickly (13 DOM in August).
Pricing Trendlines (Rolling 12-Month)
-
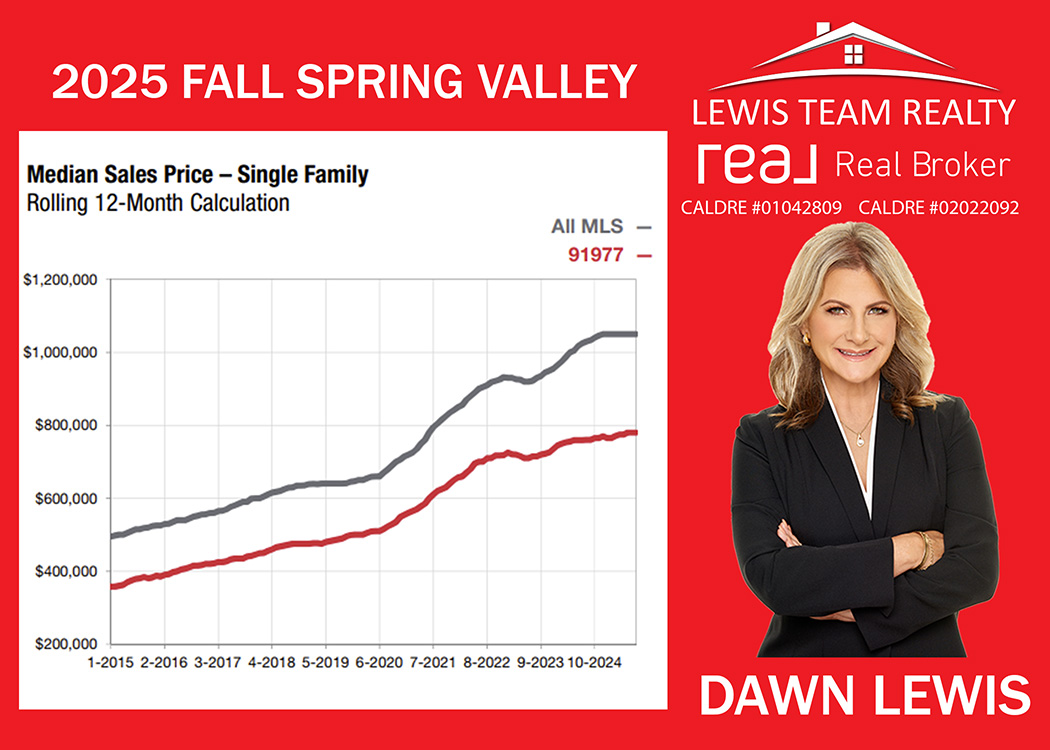
Single-Family in Spring Valley (Detached): The long-run median has stair-stepped higher since 2015, with a visible surge in 2020–2022, a pause/plateau in 2023–2024, and stabilization into 2025.
-
Townhouse/Condo in Spring Valley (Attached): A similar long-term uptrend, but more sensitive to monthly mix and smaller sample sizes, which makes YTD and rolling views essential for decision-making.
Strategy Playbook
For Sellers (Detached)
-
Price to the market, not past peaks. You can still achieve near-list outcomes (~100% of OLP) if your pricing aligns with recent comps and condition.
-
Lean inventory is your tailwind. With 2.3 months of supply, well-marketed homes can stand out. Invest in presentation (repairs, paint, landscaping, pro photos/video).
-
Plan for a measured pace. While August DOM was ~26 days, the YTD average is 33, suggesting more typical (not frantic) timelines. Set expectations accordingly.
For Sellers (Attached)
-
Expect variance. One month can look spectacular; YTD trends are firmer guides. Use hyper-local comps in your exact complex/nearby analogs.
-
Win on preparation. August’s 13 DOM shows that dialed-in listings (staging, turnkey condition, sharp pricing) can outperform even with 4.1 months of supply.
-
Be flexible. With pendings/closings down YTD, consider buyer incentives (e.g., credit for rate buydown) to widen your pool without cutting list price first.
For Buyers (Detached)
-
Act strategically, not hastily. Inventory is tight, but competition is rational. Use pre-approval + targeted terms to strengthen offers without overbidding.
-
Look for value in days-on-market. Homes lingering beyond the median 26–33 days may offer negotiation windows (repairs/credits).
-
Think total monthly cost. With near-list outcomes, focus on payment structure (rate buydowns, closing-cost credits) to optimize affordability.
For Buyers (Attached)
-
Leverage more choice. 4.1 months of supply gives you room to compare floor plans, HOAs, and condition—negotiate based on comps in your building/cluster.
-
Move quickly on the right fit. Even in a looser market, turnkey units can sell in under two weeks (August 13 DOM). Have docs and down payment lined up.
-
Underwrite the HOA. Review reserves, dues trends, and any special assessments—these materially affect your true monthly cost.
Local Context: Why Spring Valley Continues to Draw Interest
Spring Valley offers hillside neighborhoods, canyons, and quick access to SR-94/125, giving commuters a practical base with larger lots and diverse housing stock relative to many coastal zip codes. Buyers often cite value-per-square-foot, convenience to East County recreation, and proximity to greater San Diego employment hubs—factors that support demand even as rates and supply fluctuate.
Bottom Line
-
Detached: Price support remains intact with low months of supply and medians up modestly YTD. Expect a balanced, diligent market rather than a frenzy.
-
Attached: Don’t get whiplash from a single month; YTD tells the story—slower sales, slightly lower prices, but fast movement for well-prepped, well-priced listings.
If you’re planning to buy or sell in 91977, decisions are best made with hyper-local comps and an on-the-ground strategy tailored to your property type, condition, and timing. We can run a micro-comp analysis for your home or target complex and build a pricing/offer plan that fits today’s conditions.
Data source: Greater San Diego Association of REALTORS® Local Market Update for Spring Valley (91977), current as of Sept 5, 2025. All data from the San Diego MLS.