San Diego County Real Estate Market Report Fall 2025
Median Price Increases, Inventory Up, Taking Longer to Sell Homes
The San Diego housing market in August 2025 reflects a mixed performance characterized by rising prices, slower sales activity, and increasing inventory. While demand remains solid, affordability challenges and longer time on market suggest buyers are becoming more selective.

Key Market Indicators
Sales Activity
-
Closed Sales:
-
Detached homes: 1,291, down 5.2% year-over-year.
-
Attached homes (condos/townhomes): 655, down 18.3% year-over-year.
-
Overall, sales declined 10.1% across the county
-
-
Pending Sales:
-
Detached: +2.6% (1,358 contracts).
-
Attached: +1.1% (706 contracts).
-
Indicates some future stability despite recent sales declines.
-
Pricing Trends
-
Median Sales Price:
-
Detached homes: $1,075,000, up 2.4% YoY.
-
Attached homes: $675,000, down 0.1% YoY.
-
Overall county median: $915,000, up 3.4% YoY.
-
-
Average Sales Price:
-
Detached: $1,458,287, up 5.1% YoY.
-
Attached: $823,810, up 4.1% YoY.
-
Overall average: $1,244,943, up 6.7% YoY.
-
📌 Takeaway: Detached homes continue appreciating, while attached housing prices are leveling off.
Inventory & Supply
-
Inventory of Homes for Sale:
-
Detached: 3,512 (up 8.4% YoY).
-
Attached: 2,573 (up 25.7% YoY).
-
Total: 6,085 homes, a 15.1% increase
-
-
Months Supply of Inventory (MSI):
-
Detached: 2.8 months (+3.7% YoY).
-
Attached: 3.8 months (+26.7% YoY).
-
Total market: 3.2 months, up 14.3%
-
📌 Takeaway: The market is gradually shifting toward balance, especially for condos and townhomes where inventory has surged.
Market Speed & Competition
-
Days on Market (DOM):
-
Detached: 39 days, up 39.3% YoY.
-
Attached: 42 days, up 27.3% YoY.
-
Total: 40 days, up 33.3%
-
-
Percent of Original List Price Received:
-
Detached: 96.5% (-2.2% YoY).
-
Attached: 97.0% (-1.0% YoY).
-
Buyers are negotiating more, and bidding wars are less common
-
📌 Takeaway: Homes are staying longer on the market and selling below list price more often.
Affordability
-
Housing Affordability Index (HAI):
-
Detached: 26 (-3.7% YoY).
-
Attached: 41 (flat YoY).
-
Overall: 30 (-6.3% YoY).
-
📌 Takeaway: Affordability remains one of the greatest challenges in San Diego, with detached homes particularly out of reach for many buyers.
Year-to-Date (YTD) Trends (Jan–Aug 2025)
-
Closed Sales: 15,181 (-4.1% YoY).
-
Pending Sales: 15,998 (-2.0% YoY).
-
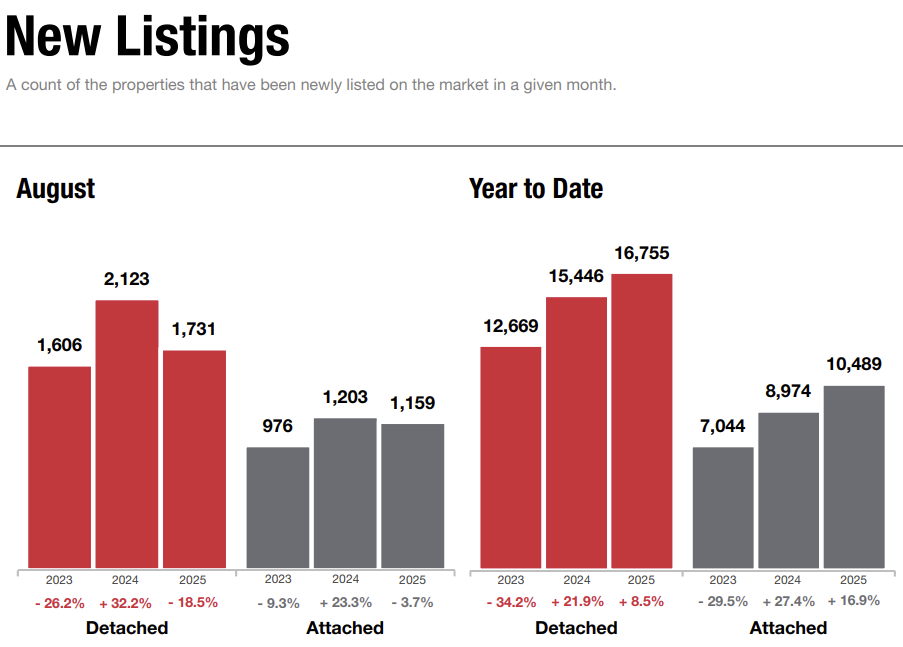
New Listings: 27,244 (+11.6% YoY).
-
Dollar Volume of Sales: $18.26 billion (-3.0% YoY).
-
Median Price (All Properties): $906,000 (+0.7% YoY).
-
Average Price (All Properties): $1.19M (+1.2% YoY).
Market Outlook
-
Inventory Growth – Buyers have more options, particularly in the attached market, which could put pressure on condo/townhome pricing.
-
Stabilizing Prices – Detached homes are still appreciating modestly, but overall price growth is slowing compared to the double-digit gains of prior years.
-
Slower Sales Pace – Higher DOM and reduced list-to-sale ratios indicate buyers are cautious and waiting for value.
-
Affordability Issues – With HAI near historic lows, demand could continue to soften unless interest rates decline.
Conclusion
The San Diego housing market in August 2025 is showing early signs of cooling after years of strong growth. Prices for single-family homes remain resilient, but sales activity is slowing, inventory is climbing, and affordability is strained. Buyers now have more leverage in negotiations, especially in the attached housing sector, while sellers must price strategically to attract offers.